Introduction
Why Looker Studio (formerly Data Studio) Report Templates?
Looker Studio Dashboard & reports offer a variety of advantages for businesses and organizations. By using these free Looker Studio templates, users can save time and effort when creating reports, as well as gain insights into key metrics and data points.
The templates are designed to be
- customizable, allowing users to tailor them to their specific needs and requirements
- shareable (i.e. anyone with the specific email or public link can access the report – you can choose your sharing options)
- and report can be easily exported to PDF
Additionally, Looker Studio Templates offer a high level of flexibility by supporting multiple platforms and devices.
You can choose from 100+ categorized free Looker Studio report and dashboard templates:
Are the templates really free?
Yes, the Looker Studio Templates themselves are free. For some marketing platforms (like Facebook, Instagram, LinkedIn, TikTok etc.) you need a data connector. These connectors can be paid.
The report templates in this huge list come from PorterMetrics and Two Minute Reports.
Where can I find other free Looker Studio Templates?
Free templates of marketing or social media tools like Facebook (Meta), Facebook Ads (Meta Ads), Instagram, TikTok, and Pinterest I can recommend
Multi-Platform Free Looker Studio Templates
Multi-platform report template for Google Looker Studio
Use this template to see how much traffic your website gets from paid media campaigns on different platforms. It works on all devices.
Multi-platform Digital Marketing Report Template
Download our report template for digital marketers to easily integrate data from Google Analytics and other social media platforms across multiple devices.
Performance Ads & Social Looker Studio Templates
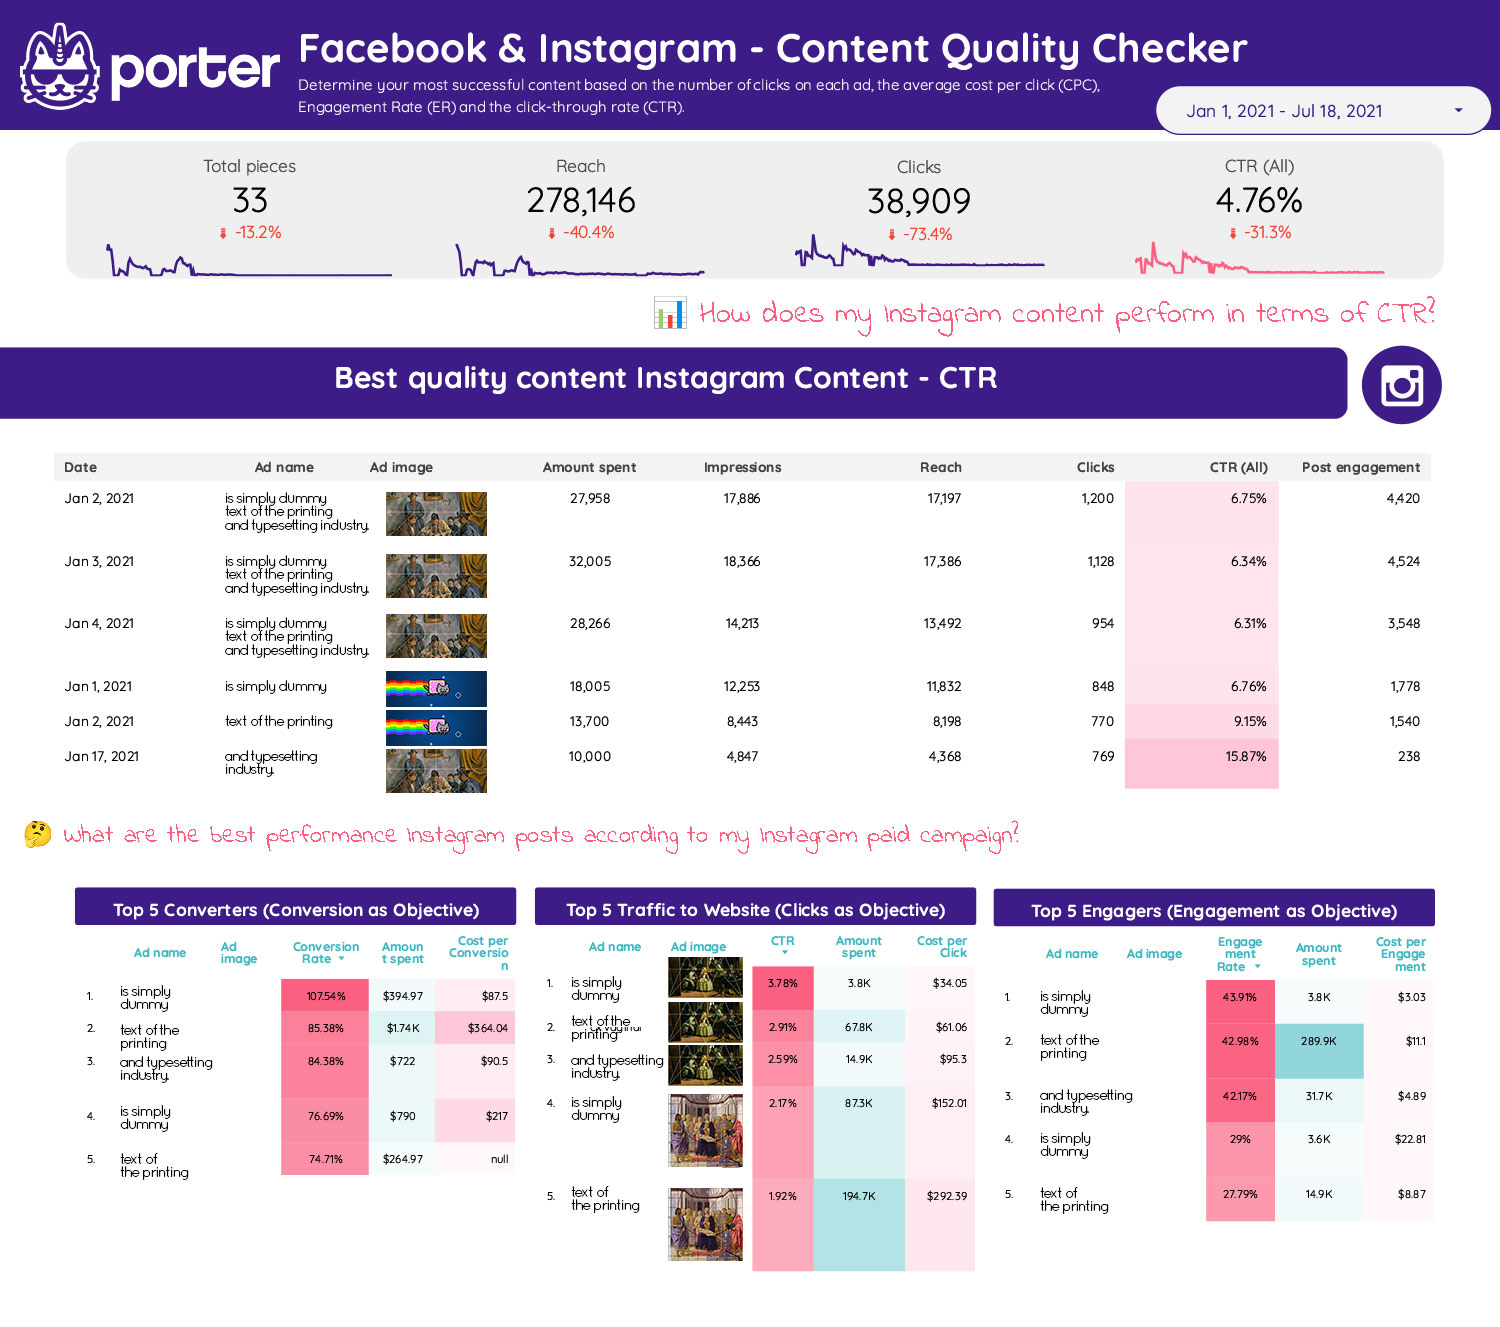
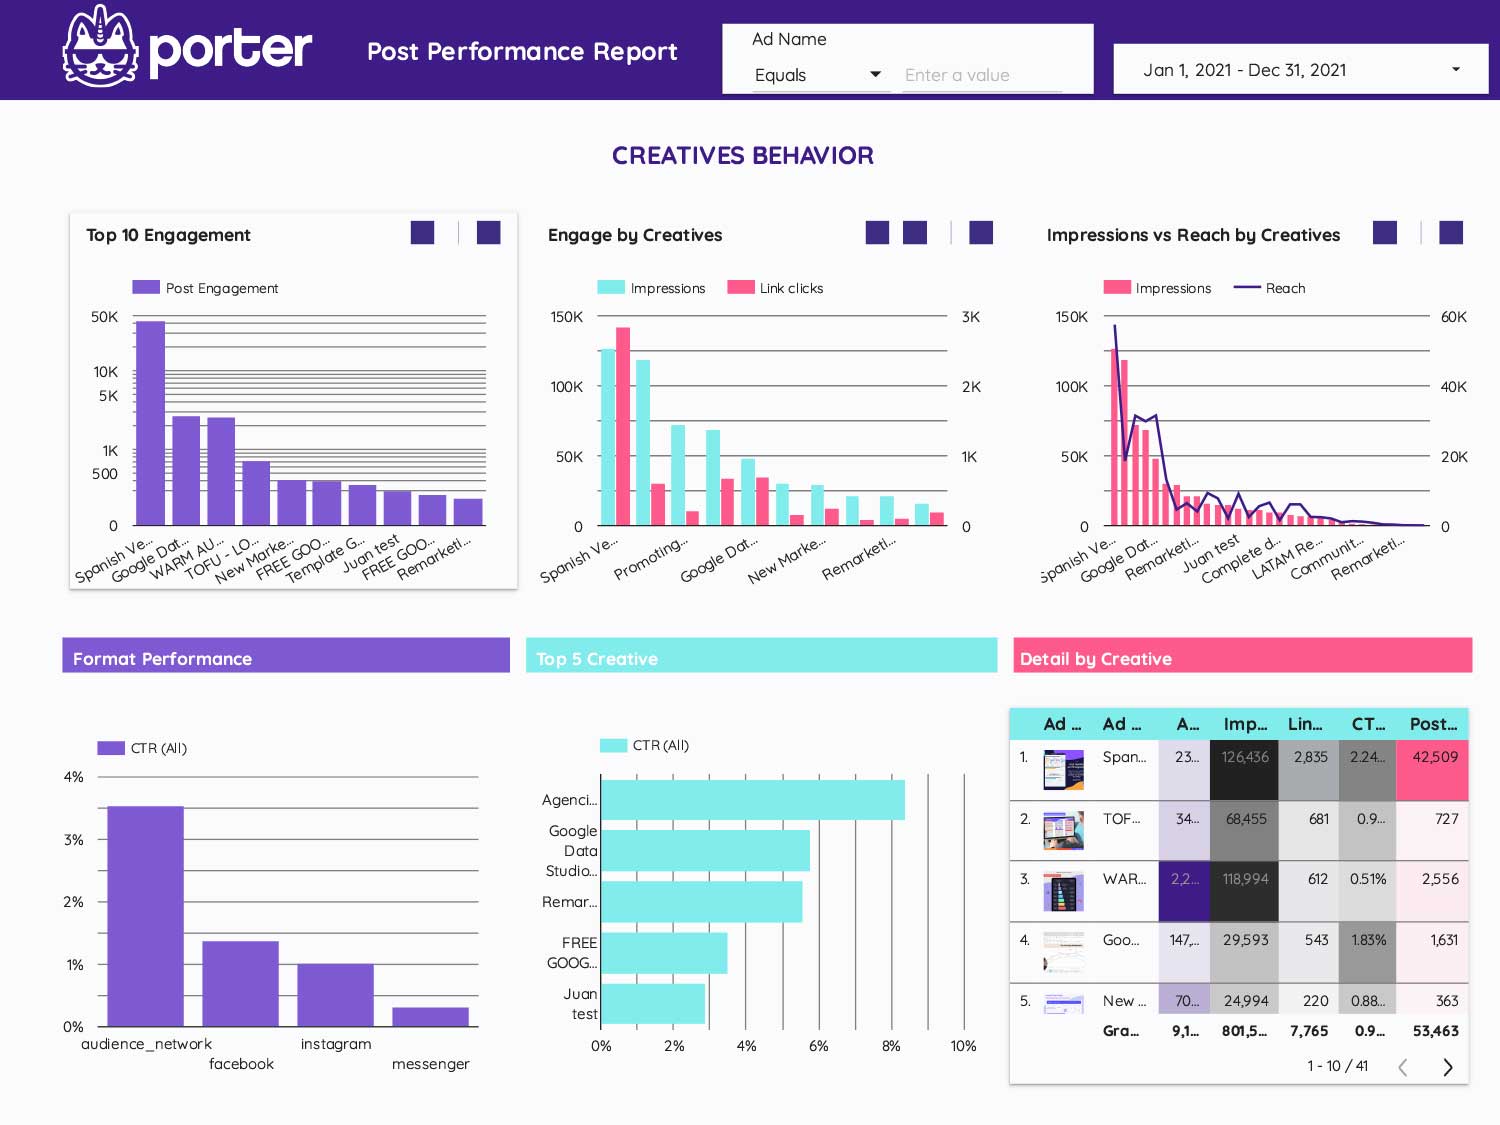
Facebook Ads creative report Looker Studio template
This Facebook Ads (Meta Ads) template will help marketers and media agencies to understand the performance of different metrics of the content created and organized by all their performance data
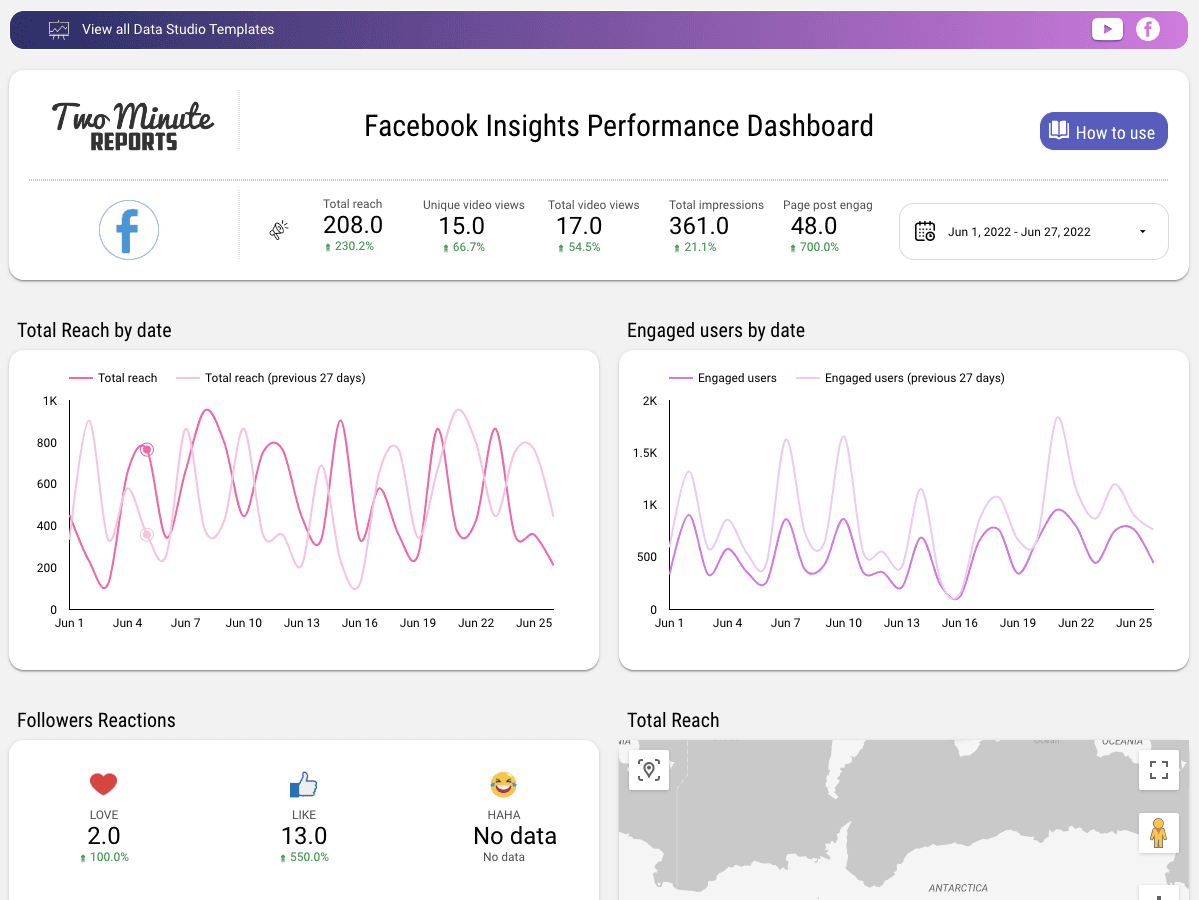
Facebook Insights Performance Dashboard
This is an interactive dashboard for Facebook insights. It provides key performance indicators such as total reach, engaged users, unique video views, total video views, and total impressions. The dashboard also includes a dedicated chart to analyze post-performance and video insights. Click on “preview” to gain a better perspective of the template.
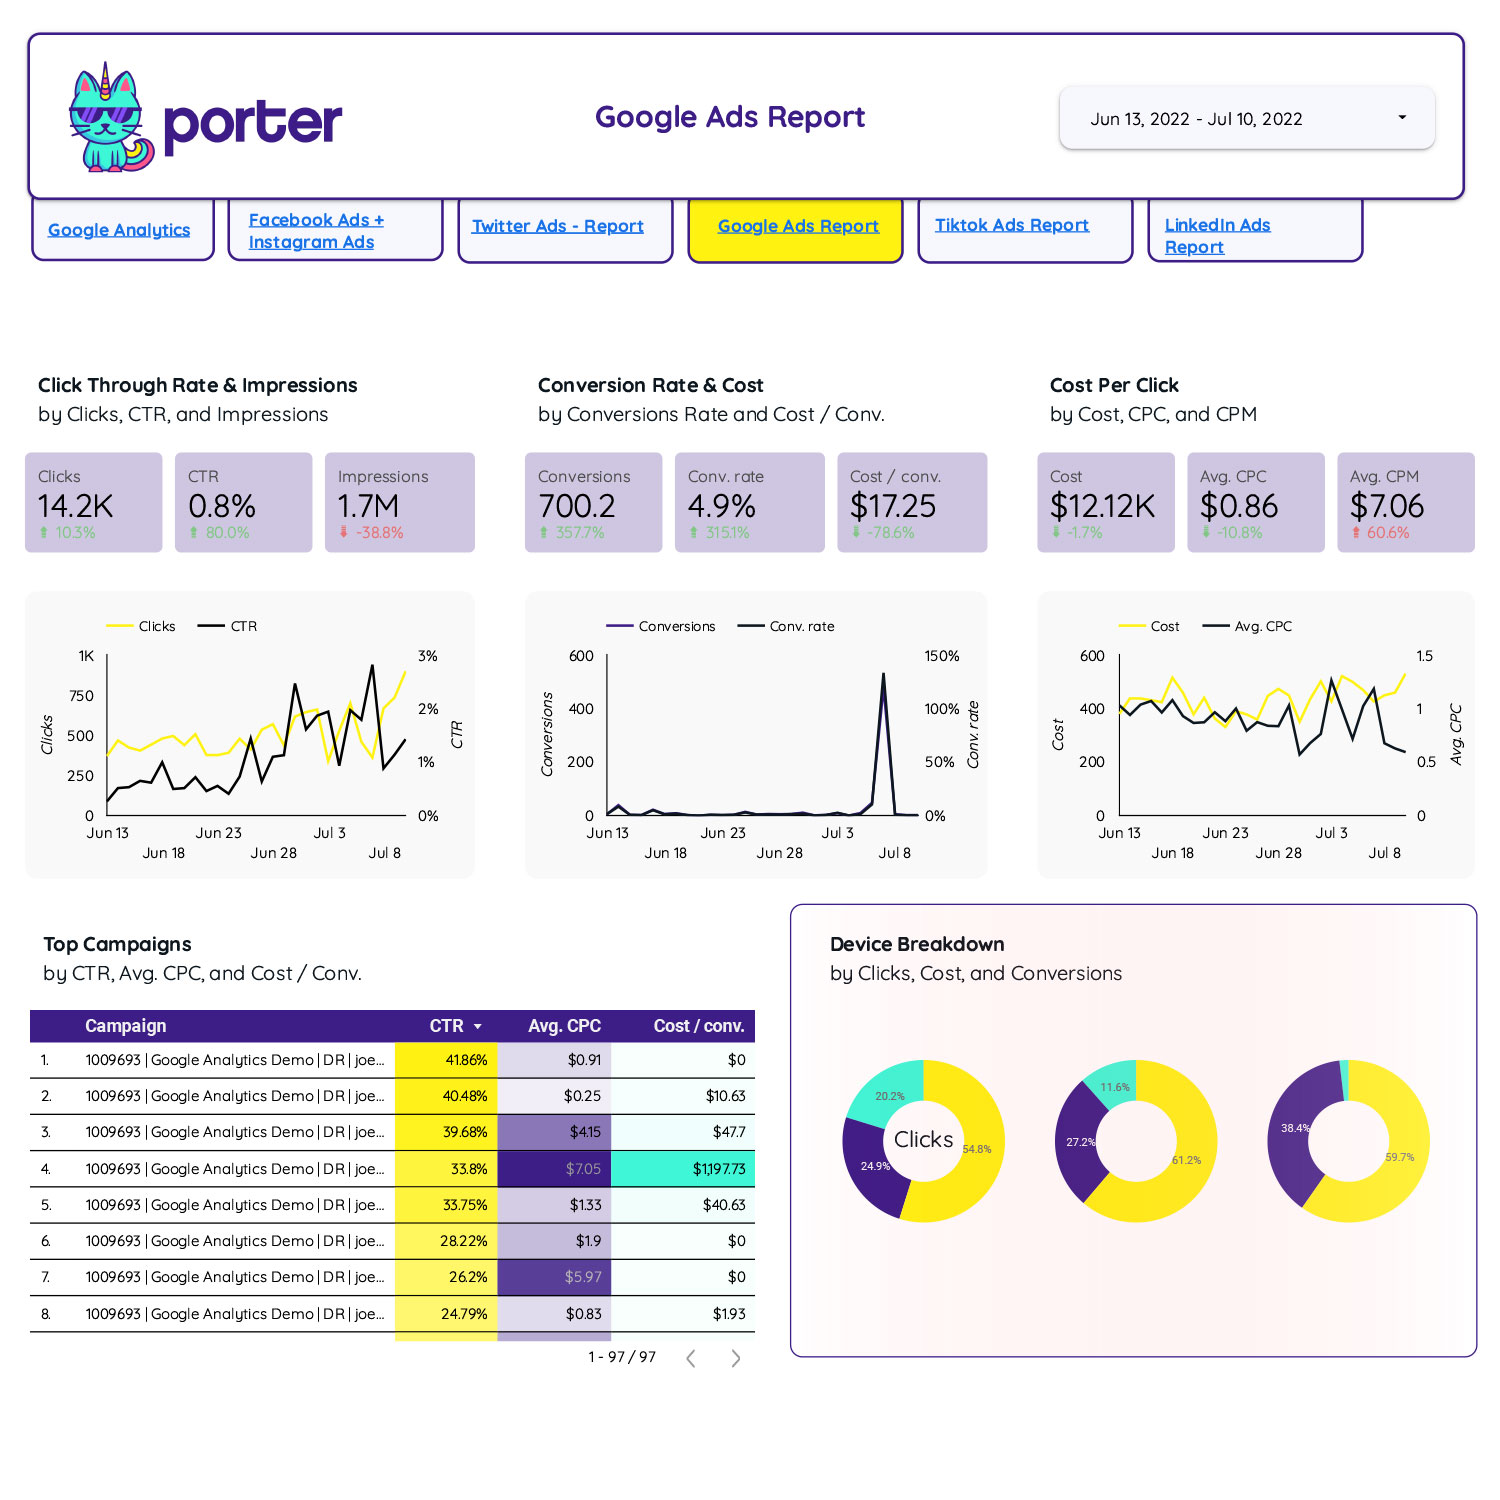
PPC report template for Google and Facebook Ads (Traffic)
Download this PPC report template for Google and Facebook ads to visualize the traffic to your website and social media platforms from multiple online campaigns.
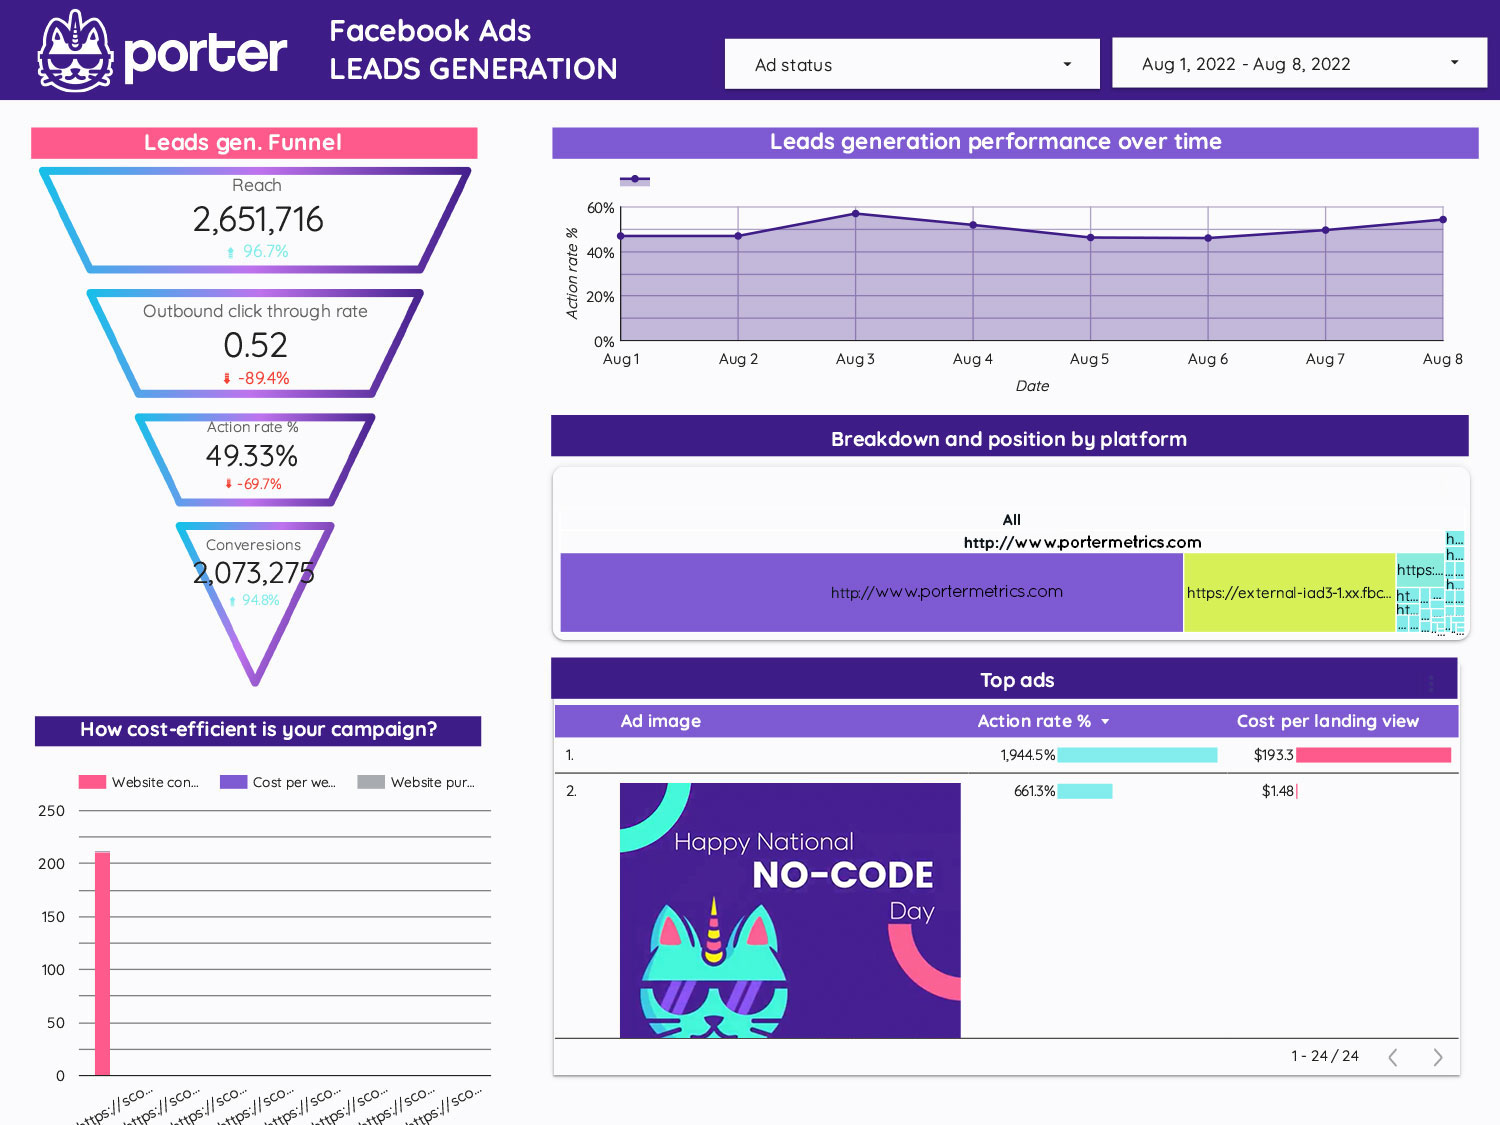
Facebook Ads leads-gen report template
We highly recommend that you take a look at our free Facebook Ads Leads Generation template. The template is designed specifically for marketers and provides a comprehensive display of lead acquisition and ad metrics across several funnels. By using this template, you can gain a deeper understanding of your target audience and how they interact with your ads.
Monthly Facebook Ads client report in Looker Studio
Looking for a Facebook Ads monthly report template? Download it for FREE and start automating your reporting.
Free Facebook Ads funnel report template
Looking for a Free Facebook Ads funnel template? Check out our free report template for marketers and data analysts.
Free Facebook Ads report template for marketers and agencies
Looking for a Free Facebook Ads report template for marketers and agencies? Check out our free report template for marketers.
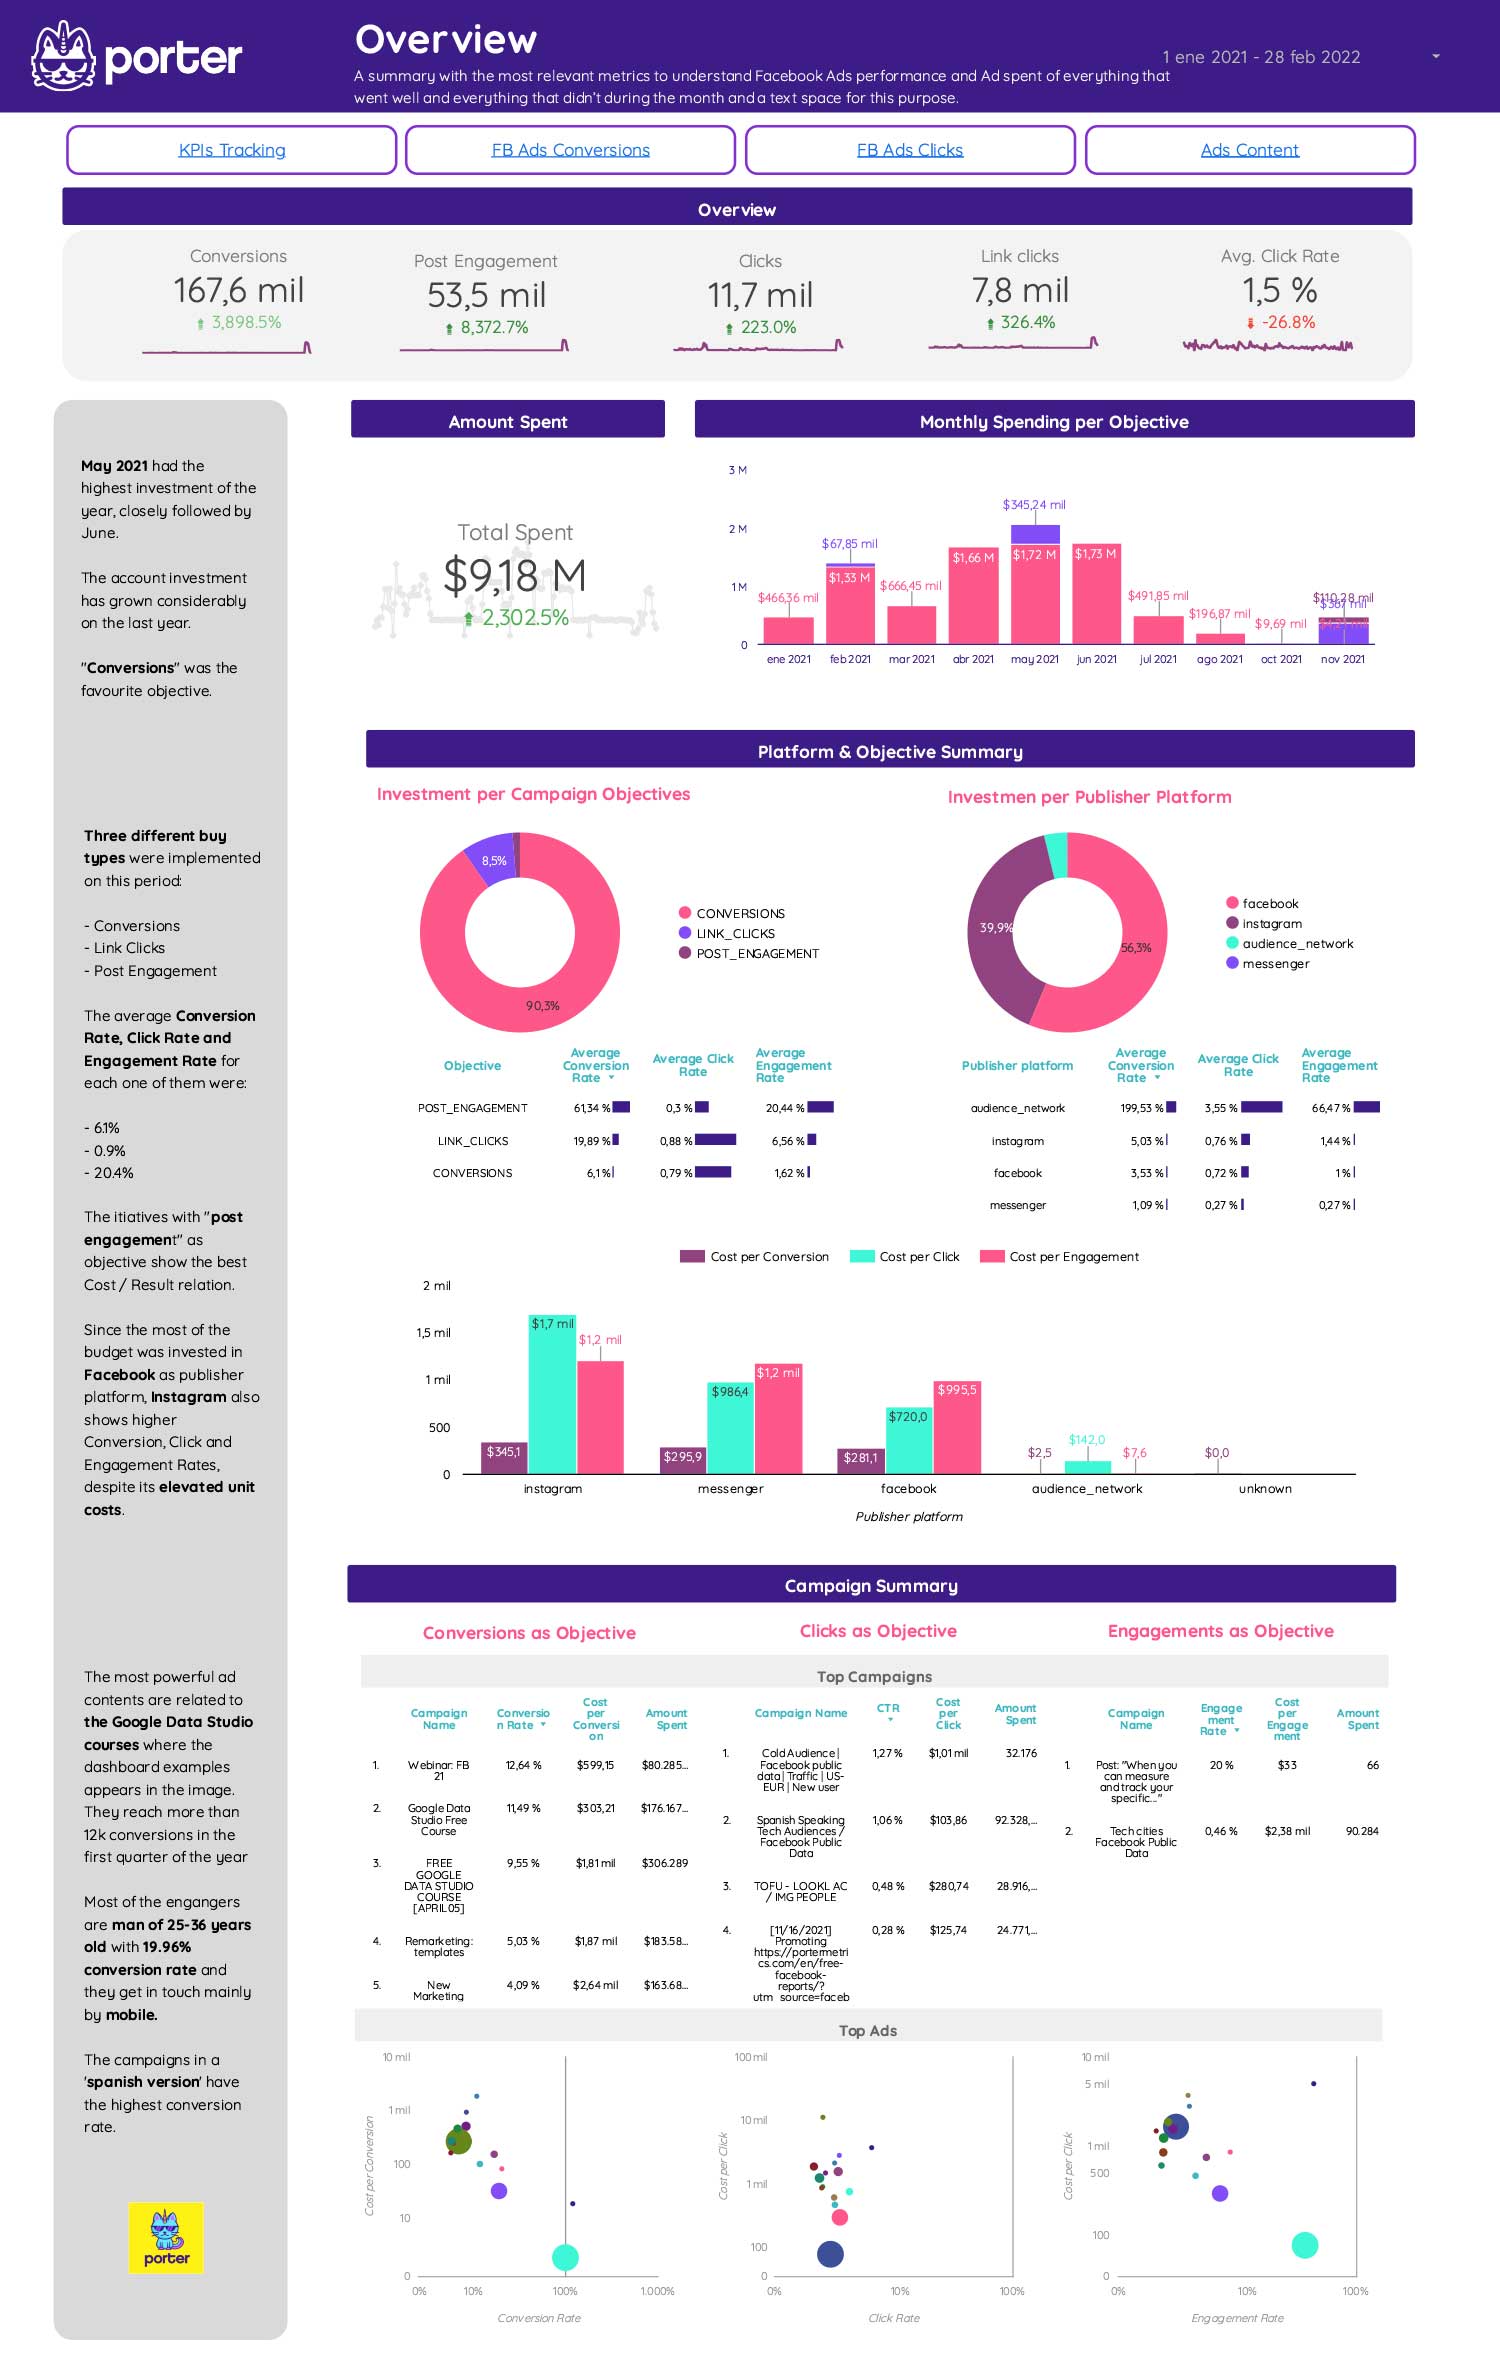
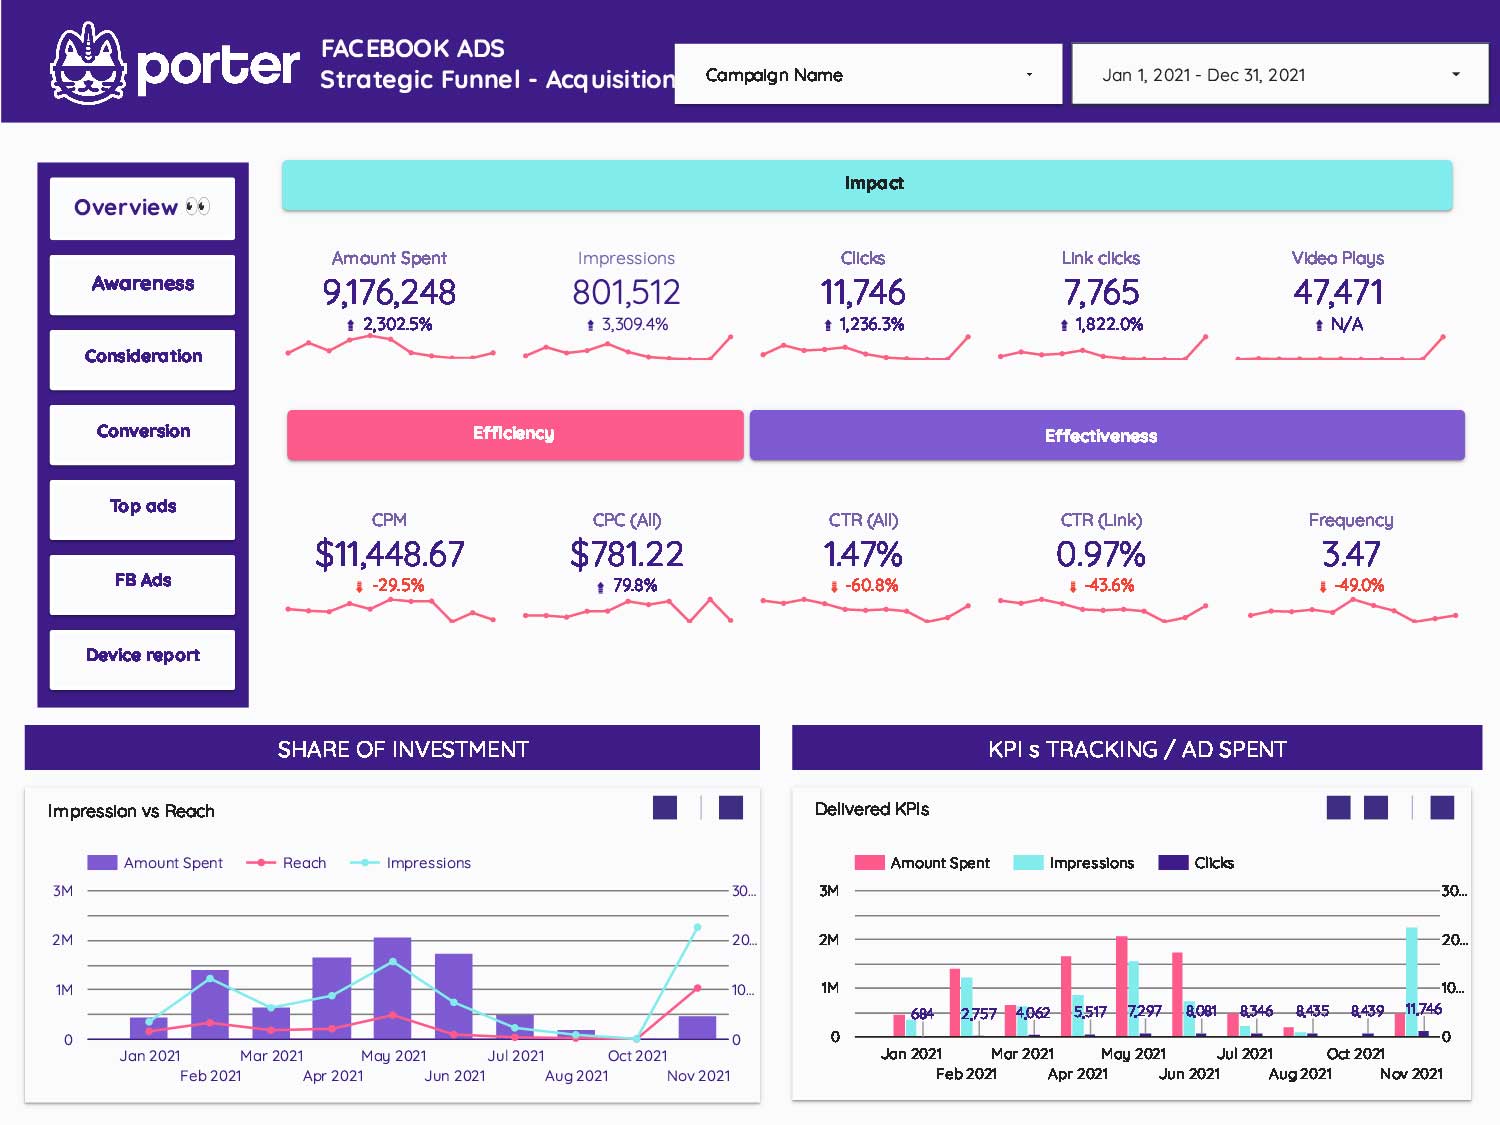
Facebook Ads Key Metrics – Free Looker Studio Rport template
Have a wider vision of your campaigns keeping on hand the information you need to read your main KPIs, metrics, and ad spent.
Free LinkedIn Analytics Report Template
Are you looking for a Free LinkedIn Analytics Report Template? Check out this Free LinkedIn Analytics Report Template.
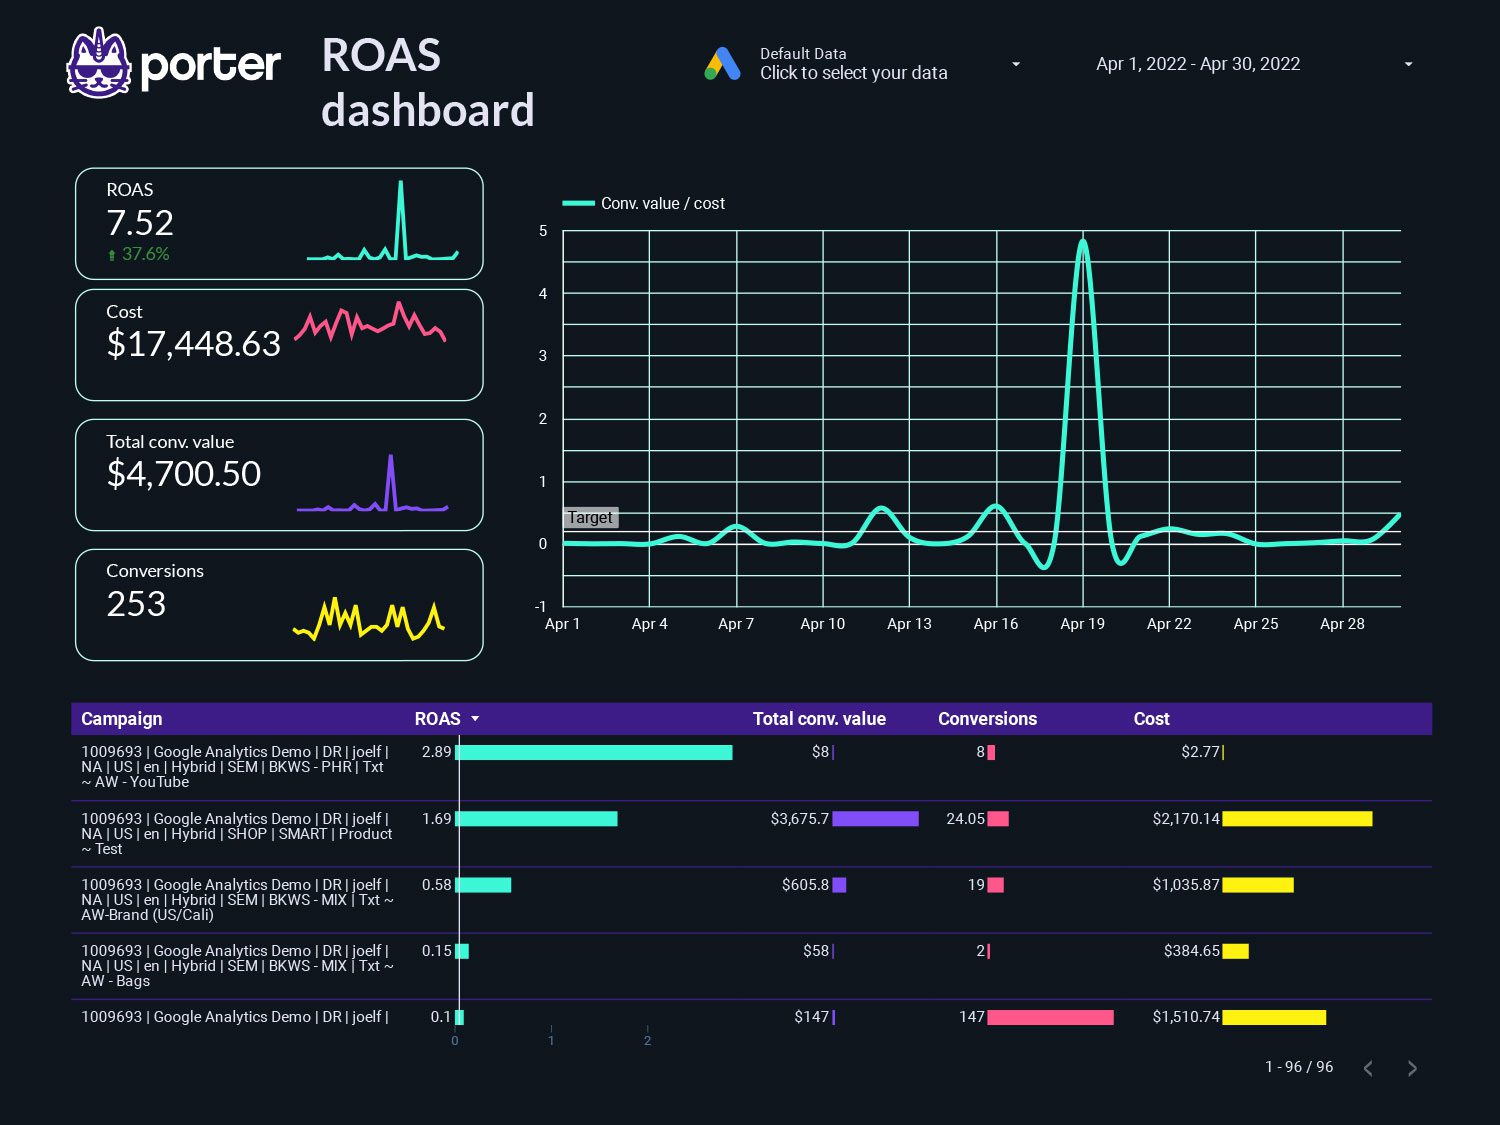
ROAS dashboard: free report template
Looking for a ROAS dashboard: free report template? Check out our free report template for marketers and data analysts.
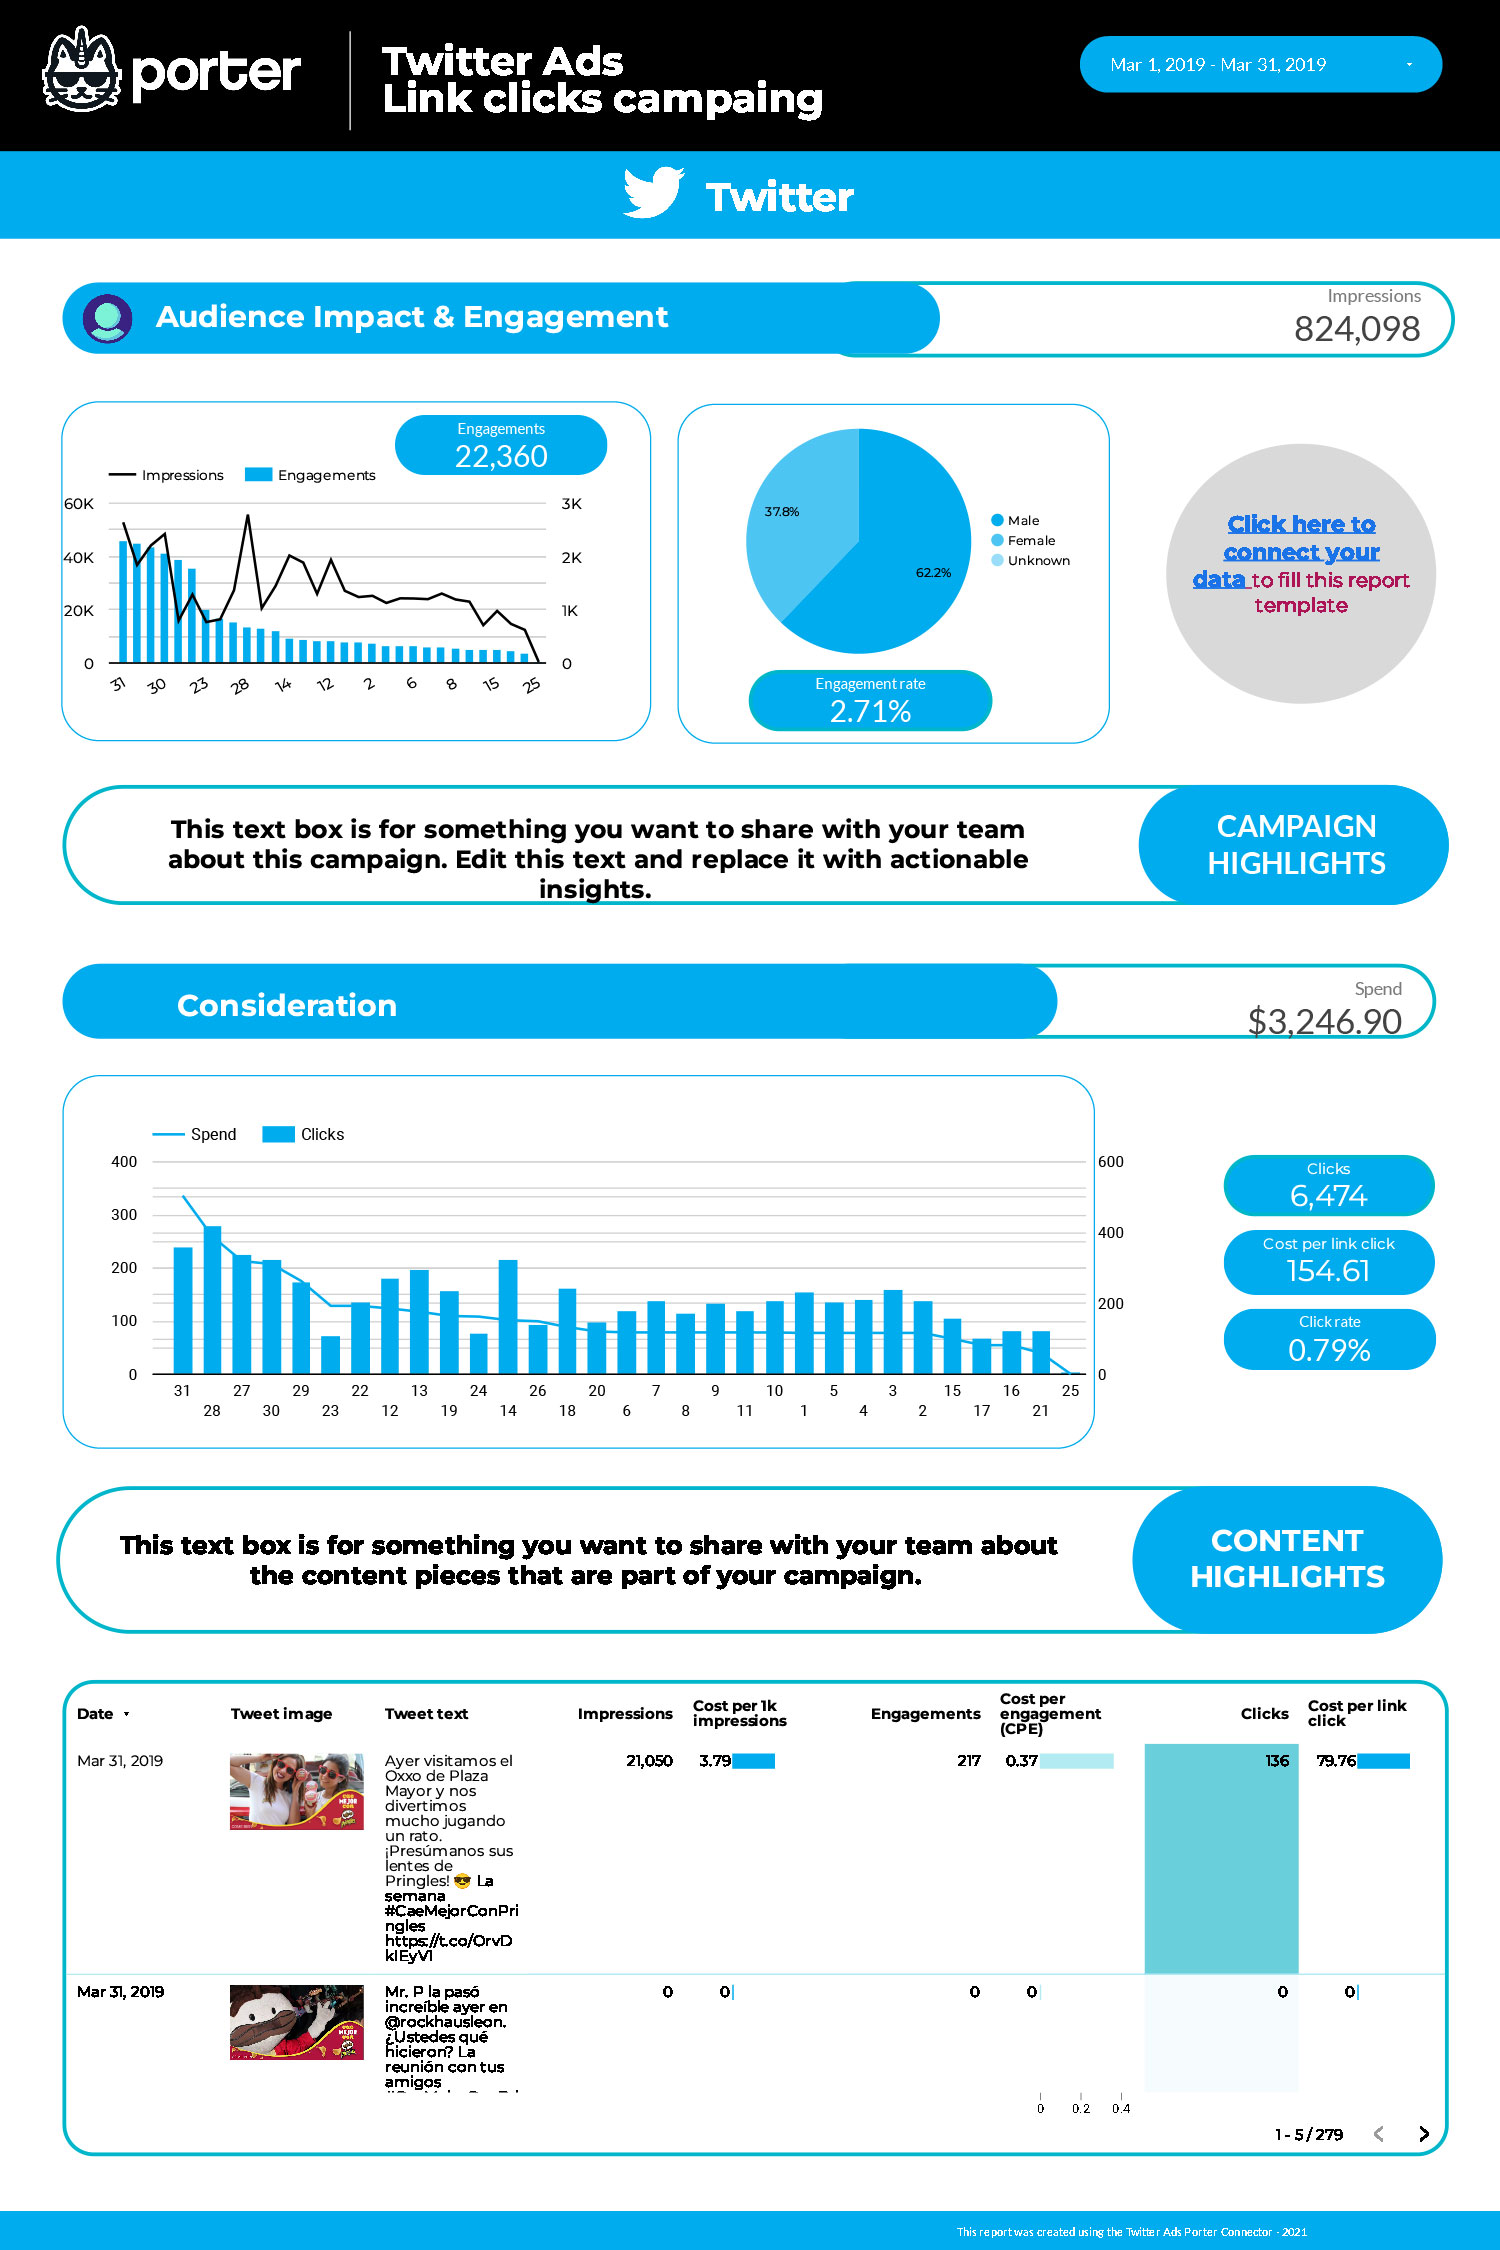
Twitter Ads dashboard: free report template for Google Looker Studio
Looking for a Twitter Ads dashboard: free report template for Google Looker Studio? Check out our free report template for marketers.
Facebook Ads creative report template
This Facebook Ads template will help marketers and agencies understand the performance of their content based on different metrics.
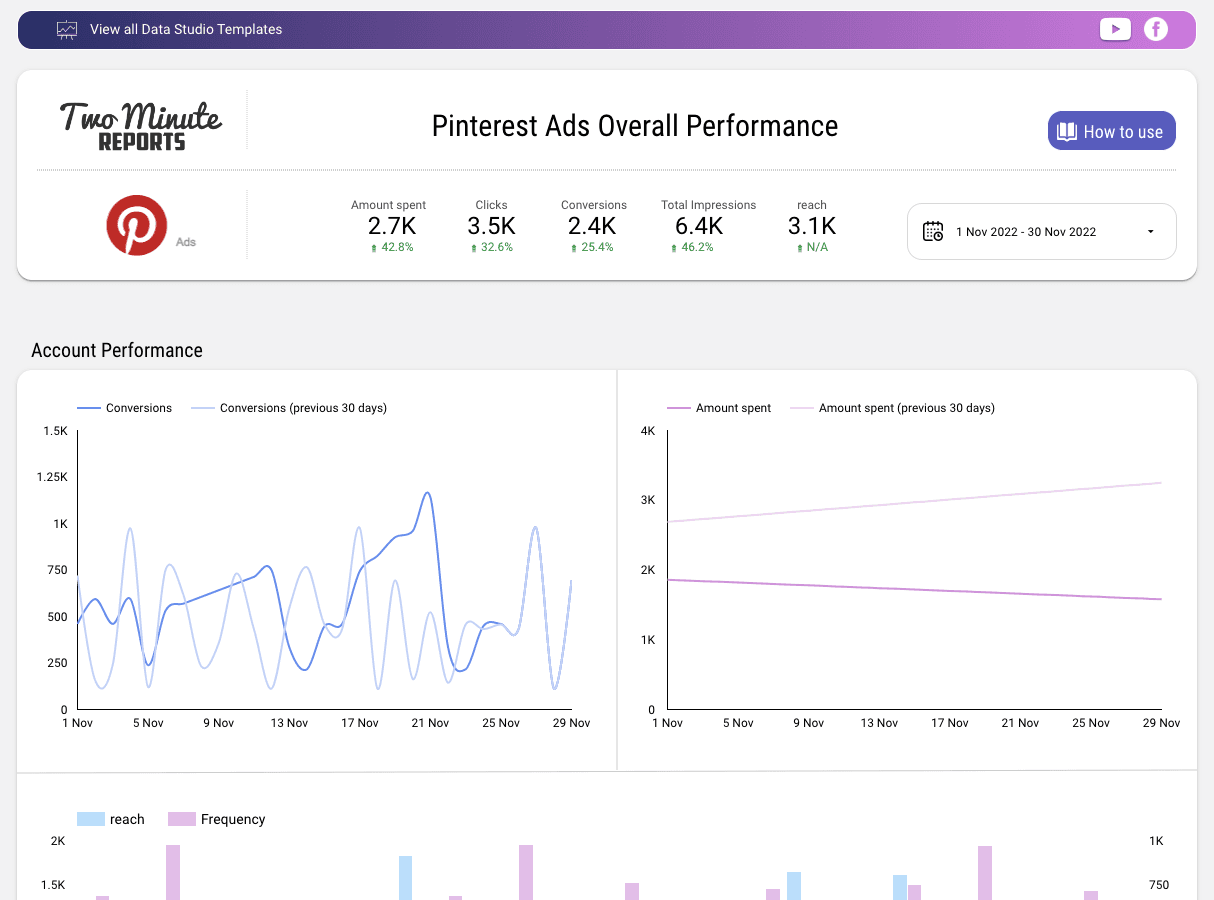
Pinterest Ads Overall Performance Report
A Pinterest Ads Performance Template has been developed for marketers with scorecards for metrics such as Amount Spent, Clicks, Conversions, Total Impressions, and Reach, including comparison data from the previous month. The template also features a date range control and an Account Performance section with graphs comparing Conversions vs Amount Spent and Reach vs Frequency across previous date ranges.
The Campaign Performance section includes a table with date-wise information on Campaign name, Clicks, CPC, Conversions, CPE, and Amount Spent, along with suitable heatmaps. The Ads Performance chart provides insights on Clicks, Reach, CPC, CTR, and Frequency.
Finally, the template features geo and pie charts for Reach by Country, Gender, and Campaign name.
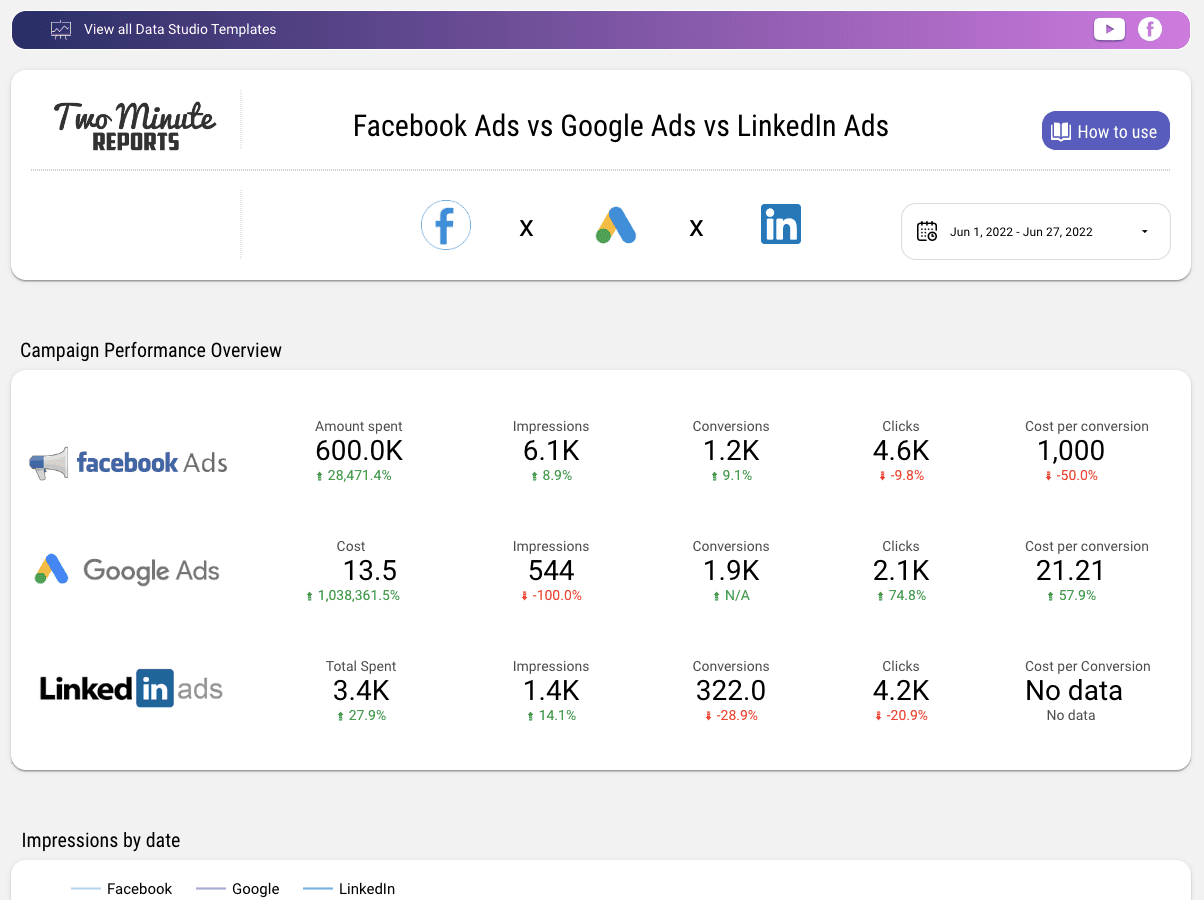
Facebook Ads vs Google Ads vs LinkedIn Ads
This is a multi-data source free Looker Studio dashboard that provides all the main KPIs of Facebook Ads, Google Ads, and LinkedIn Ads. You can view a collection of scorecards for metrics such as Amount Spent, Conversions, Impressions, Clicks, and Cost per Conversion for all three data sources. Additionally, there is a dedicated table chart that compares Cost and Impressions across all three data sources. You can also view an Impressions Graph and a Geo Chart for clicks worldwide. Check out the template to gain a better understanding of its capabilities.
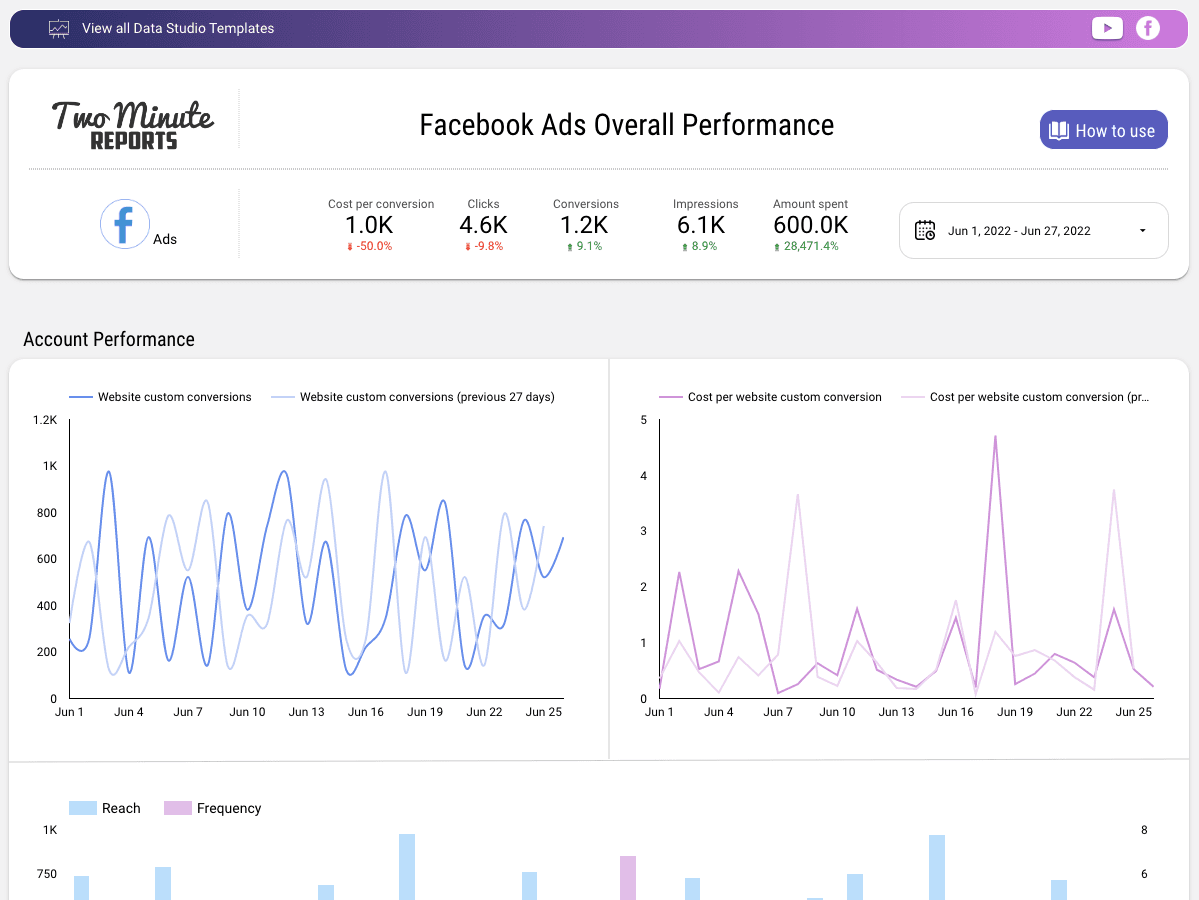
Facebook Ads overall Performance
This is a fully loaded Facebook Ads Template which can get you almost all the KPI’s a marketer would need to view and analyze. We have Campaign and Ad Analysis with Images, which makes your work much simpler. Comparison graphs are created for Account performance and other KPI’s like Conversions, Cost per Conversions, Impressions, Amount Spent etc.. Do check the preview of the Template to get a better perspective.
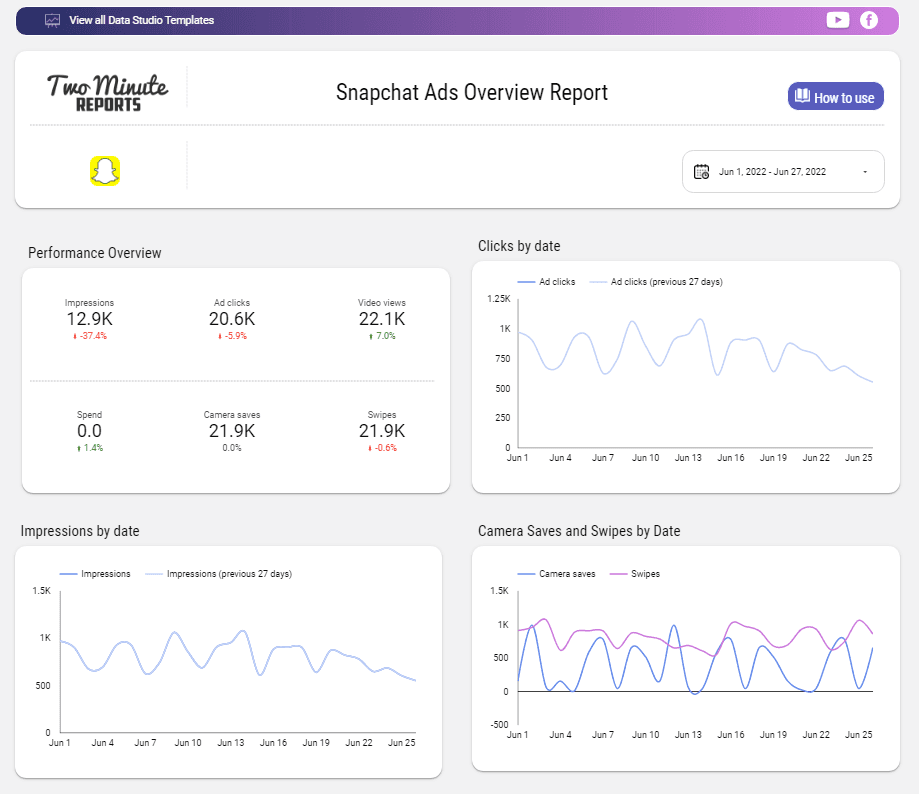
Snapchat Ads Overview Report
This is a sophisticated Snapchat Ads template with a single page that allows you to monitor all of your ads reporting from a single sheet. You can see your Performance Overview, Impressions from different mediums, Clicks for different dates, and Camera Saves and Swipes by date.
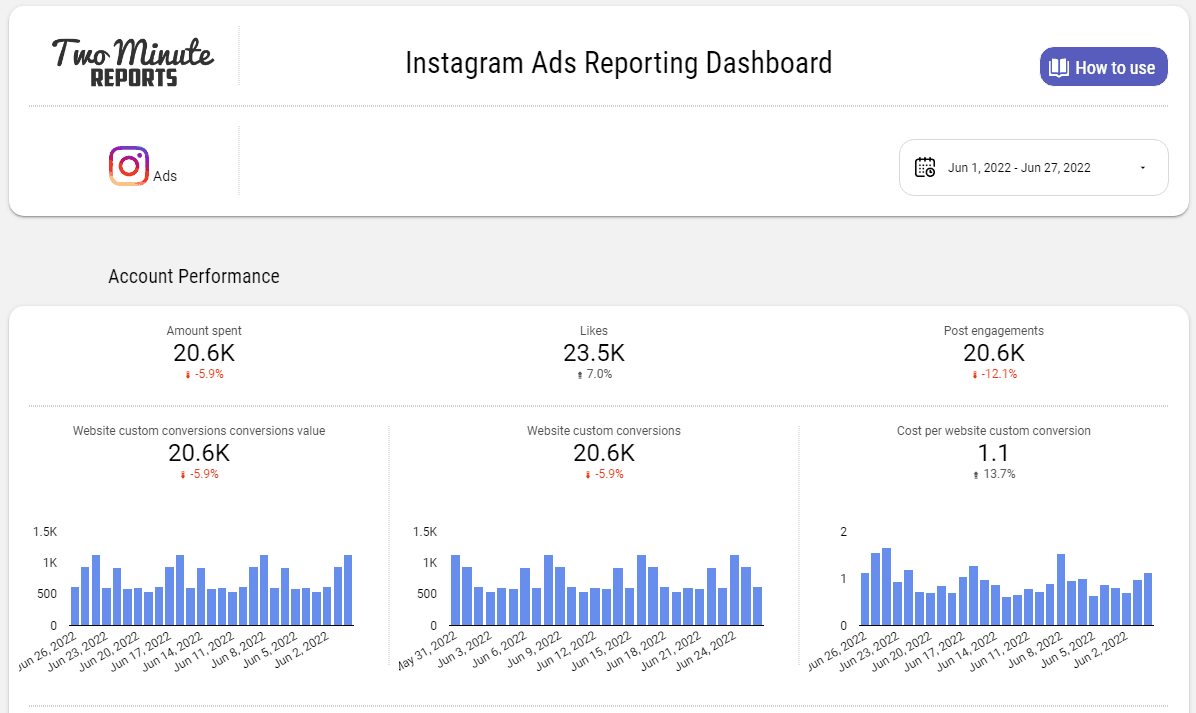
Instagram Ads Reporting Dashboard
This is a sophisticated Instagram Free Looker Studio template with a single page that allows you to monitor all of your ad reporting from a single sheet. You can see your account performance, campaign performance, ad performance, audience insights, and post insights.
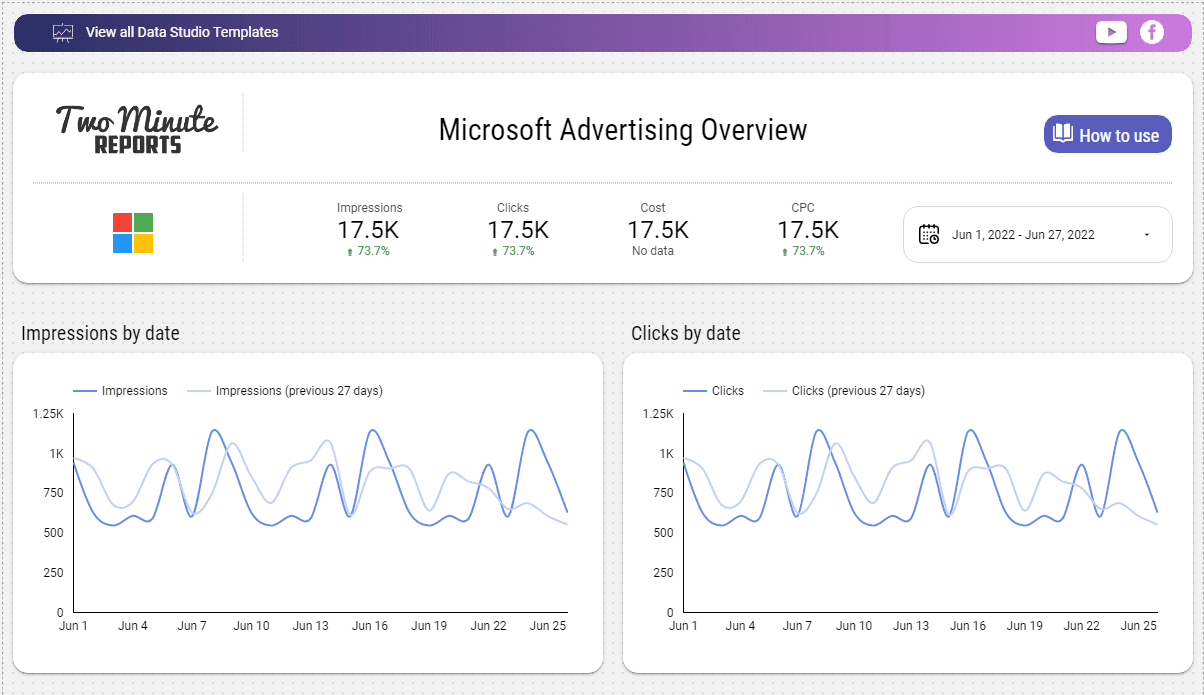
Microsoft Advertising Looker Studio Report
This is a single paged sophisticated Microsoft ads/ Bing ads template, which consists of KPI’s like Impressions, click, Spend, CPC and Cost. It consists of smooth line charts for Impressions and Clicks and table charts to view Account Summary, Campaign Performance and Ads Performance, with 27 days comparison data for all charts.
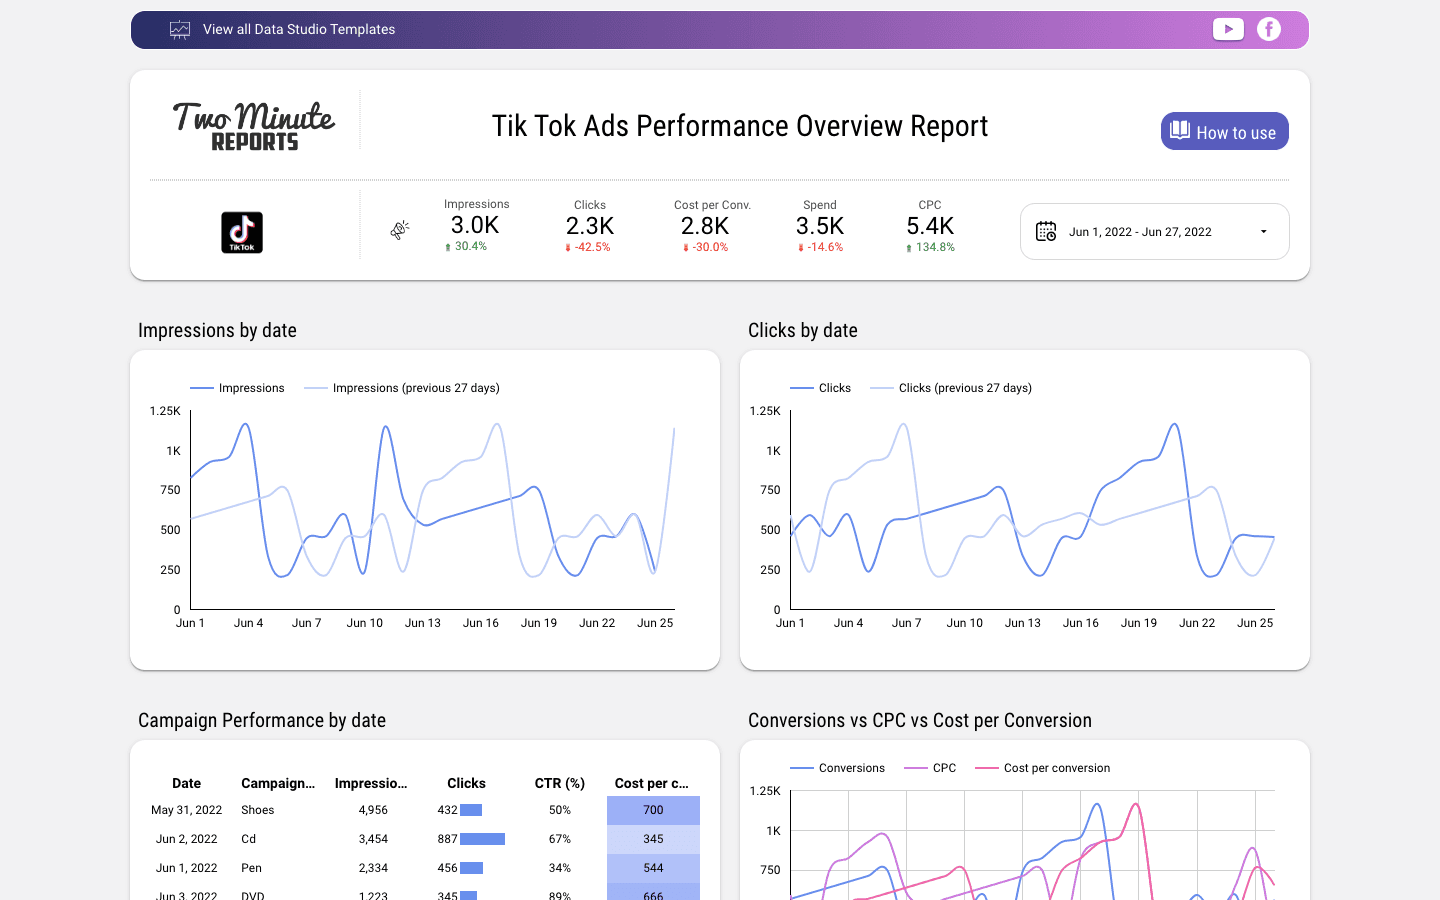
Tik Tok Ads Performance Looker Studio Report
This is a single paged sophisticated Tik Tok ads template, which consists of KPI’s like Impressions, click, Spend, CPC and Cost per conversion. It consists of Geo charts, smooth line charts, and table charts with 27 days of comparison data. Click on preview to have an exact look of the template. You can also add your data source and view the Report.
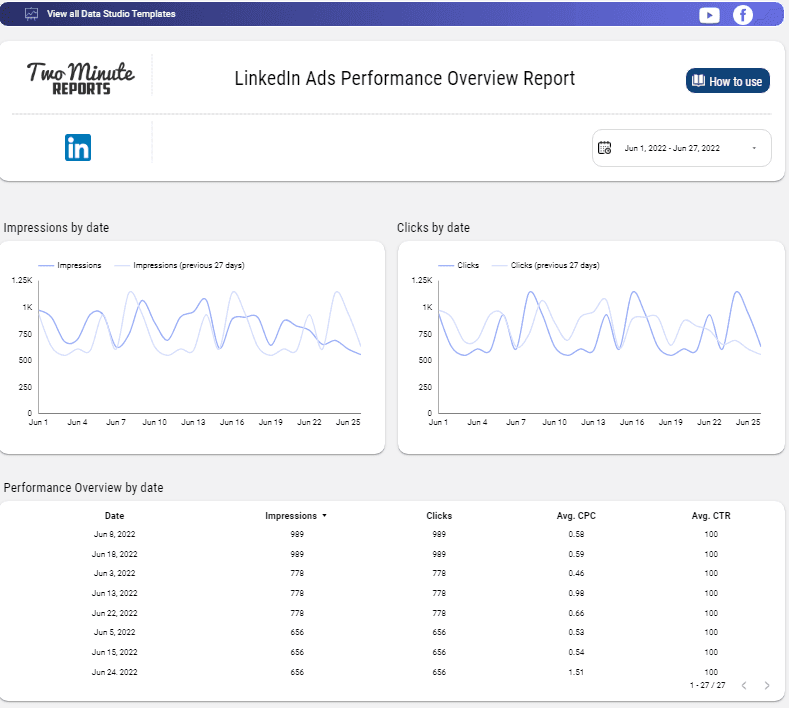
LinkedIn Ads Performance Overview Report
The Performance Overview Template can assist you in measuring the overall Ad performance of your company, providing a high-level overview.
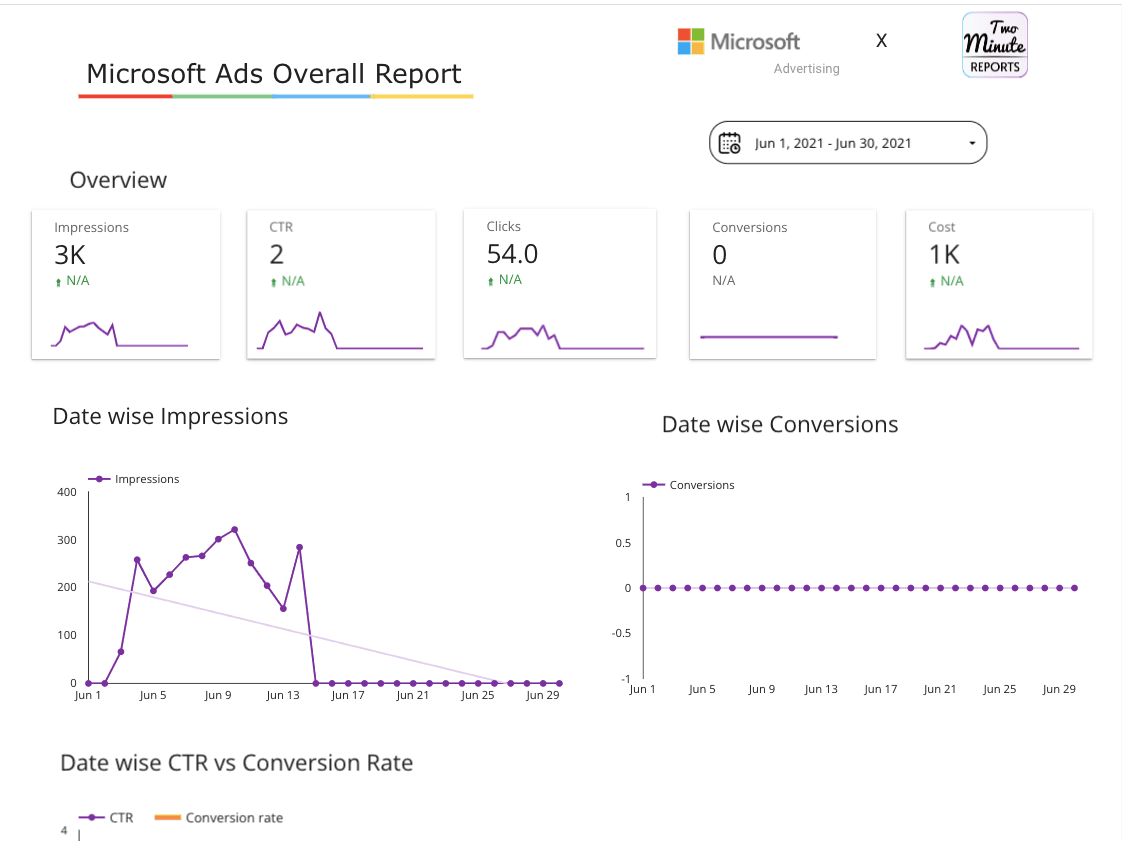
Microsoft Ads Overall Report
This free Looker Studio template is designed to provide users with an in-depth analysis of their campaign performance. It includes several key features such as:
- Scorecards for major KPIs such as CTR, impressions, clicks, cost, and conversions
- Graphs dedicated to date-based impressions, conversions, and CTR versus the conversion rate
- A table for Campaign Overview that includes all campaign KPIs such as campaign name, campaign type, impressions, CTR, clicks, and more
- Graphs and tables for Ad Groups, Search Queries, Gender Demographics, and more
By utilizing this template, users can gain valuable insights into their campaign performance and take informed decisions that can help improve their overall performance. For more information and a preview of the template, please refer to the preview template.
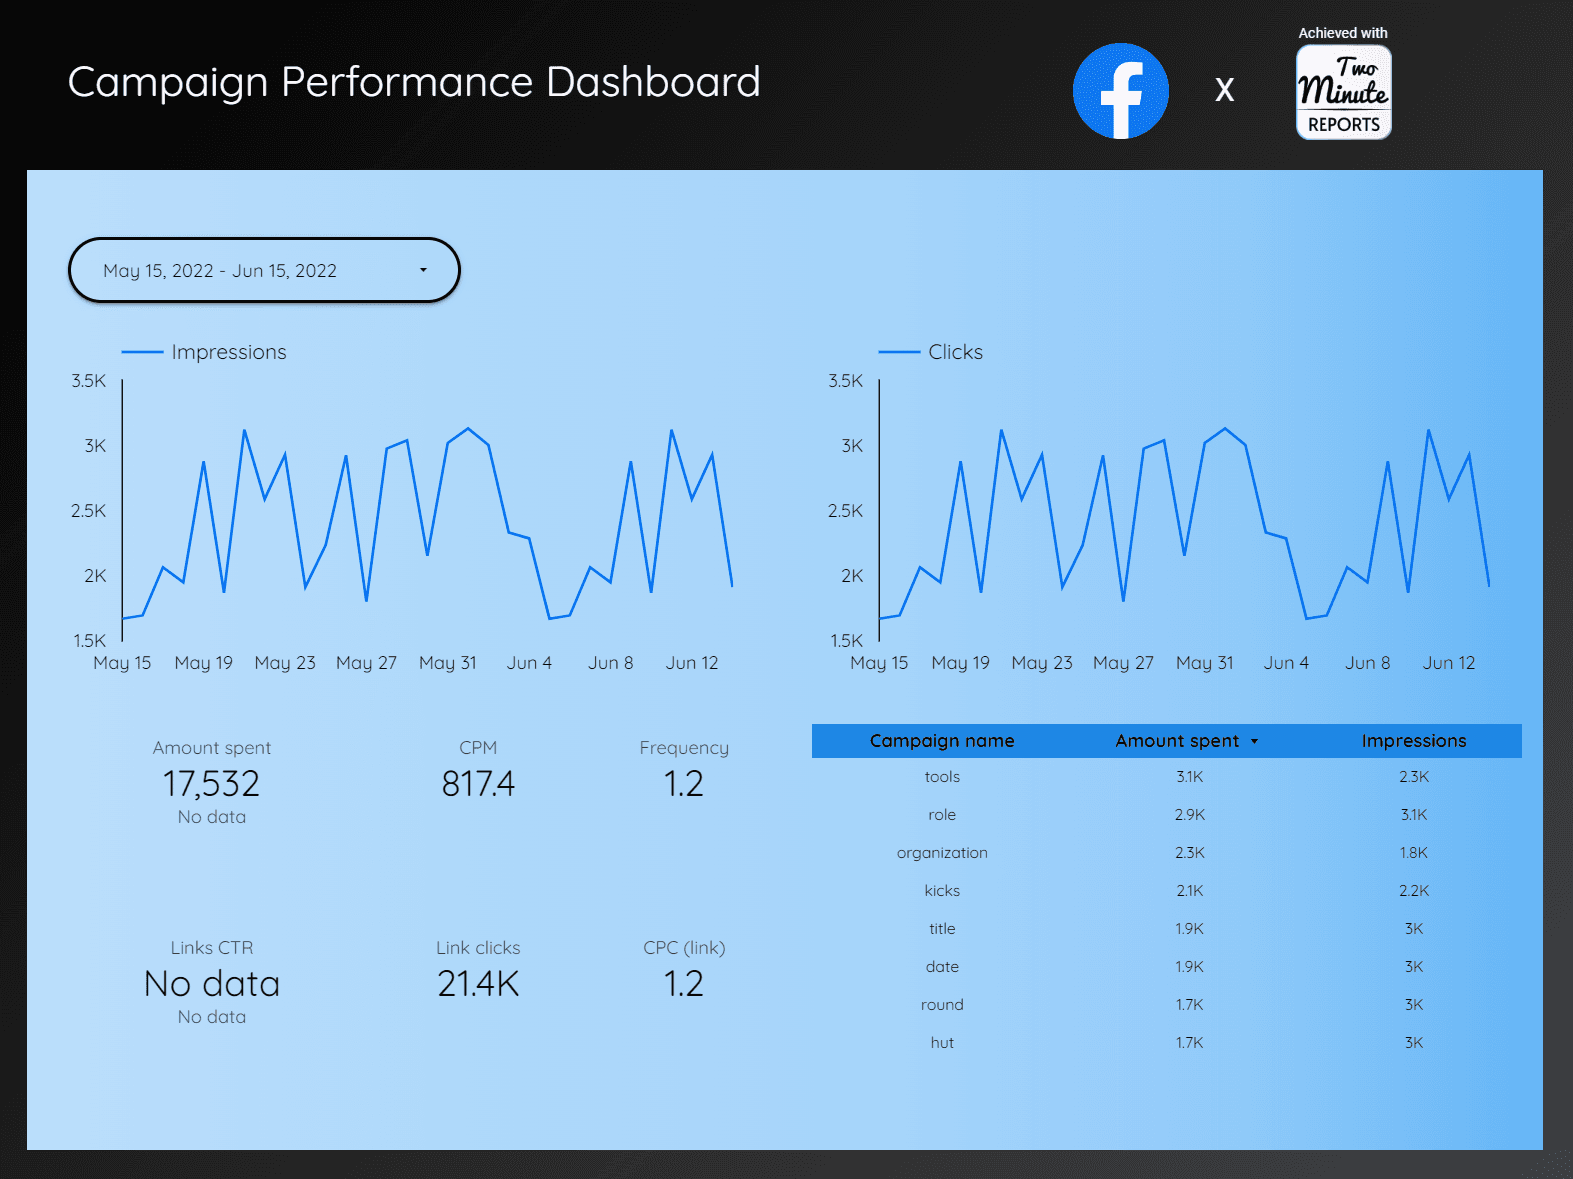
Campaign Performance Dashboard – Facebook Ads
This is a fantastic template for the modern audience, to get an overview of their campaign performance for Facebook Ads. This template contains line charts to view Impressions and Clicks, scorecard charts to give a resume, and a comparison table to view the Impressions and Amount Spent on different campaigns. All these metrics can be controlled using the date filter at the top. C
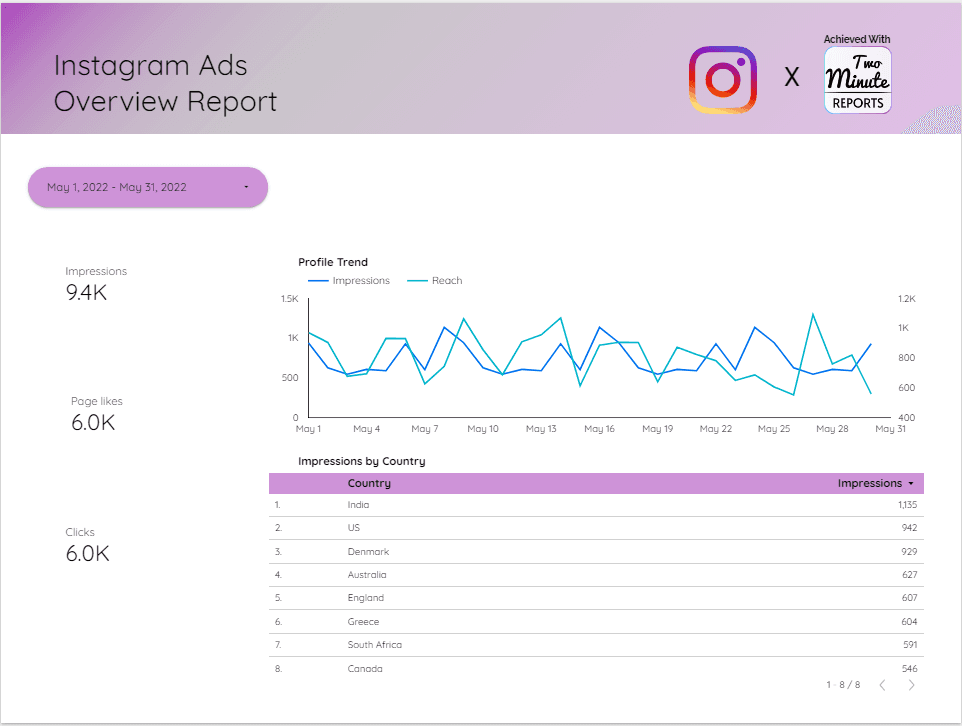
Instagram Ads Overview Report
This is a unique and interactive Instagram Ads template. It includes descriptive line charts to display your profile trends, scorecard charts for impressions, page likes, clicks, post engagement, post reactions, and post comments, as well as a bar graph to show clicks by gender. Additionally, tables show impressions in different countries and campaign performance. All of these metrics can be controlled by using the date filter at the top.
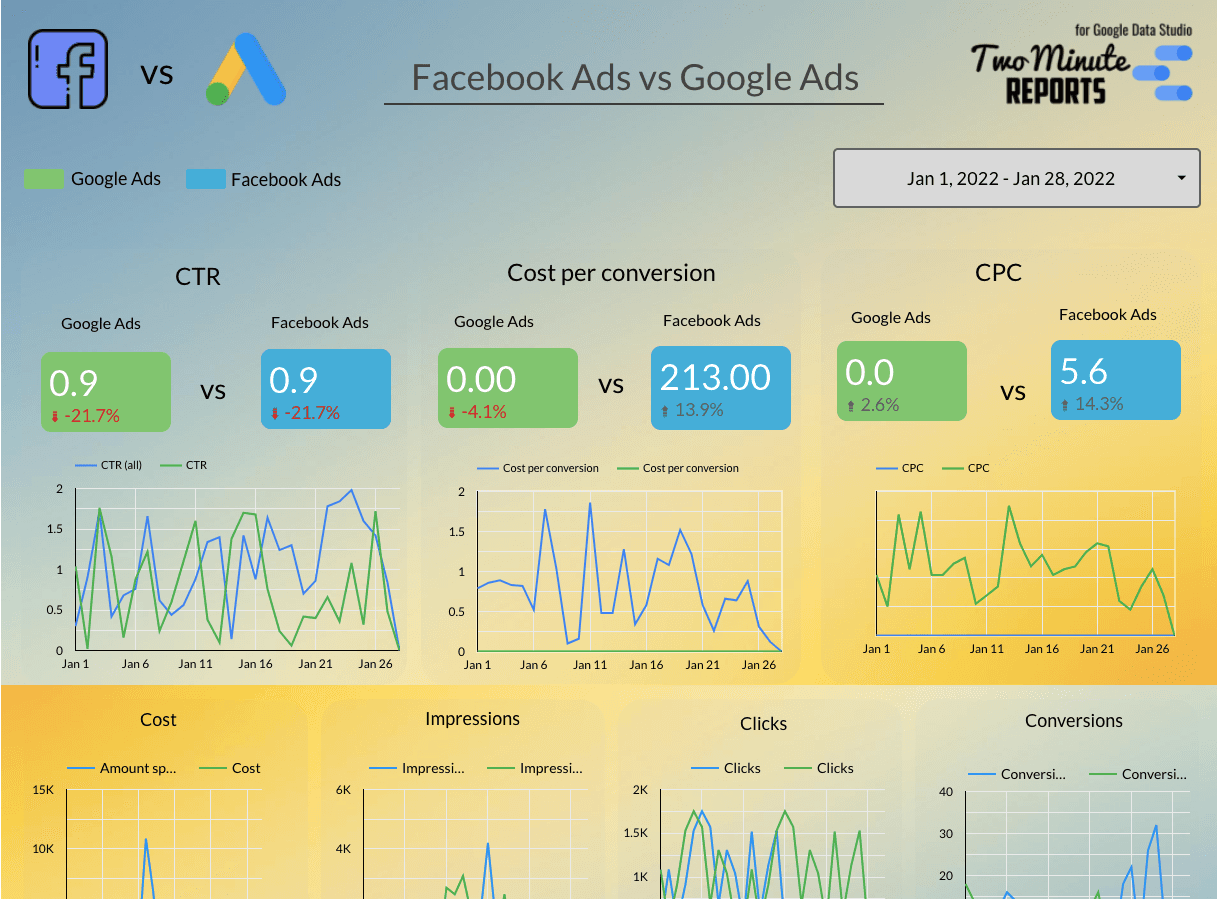
Google Ads VS Facebook Ads
This is a comparative template that compares key metrics like CTR, CPC, cost per conversion, cost, impressions, clicks, and conversions using graphs and scorecards for Google Ads and Facebook Ads. A dedicated table for campaign KPIs is included, which consists of lead field date, the amount spent, impressions, link clicks CTR, conversions, and conversion ranking scores.
You can access the GEO charts to see where your clicks are generated globally. Additionally, there is a bar graph that shows clicks split by device type. This template is an ideal solution for users who regularly use Facebook and Google Ads, as it provides a short and concise report. C
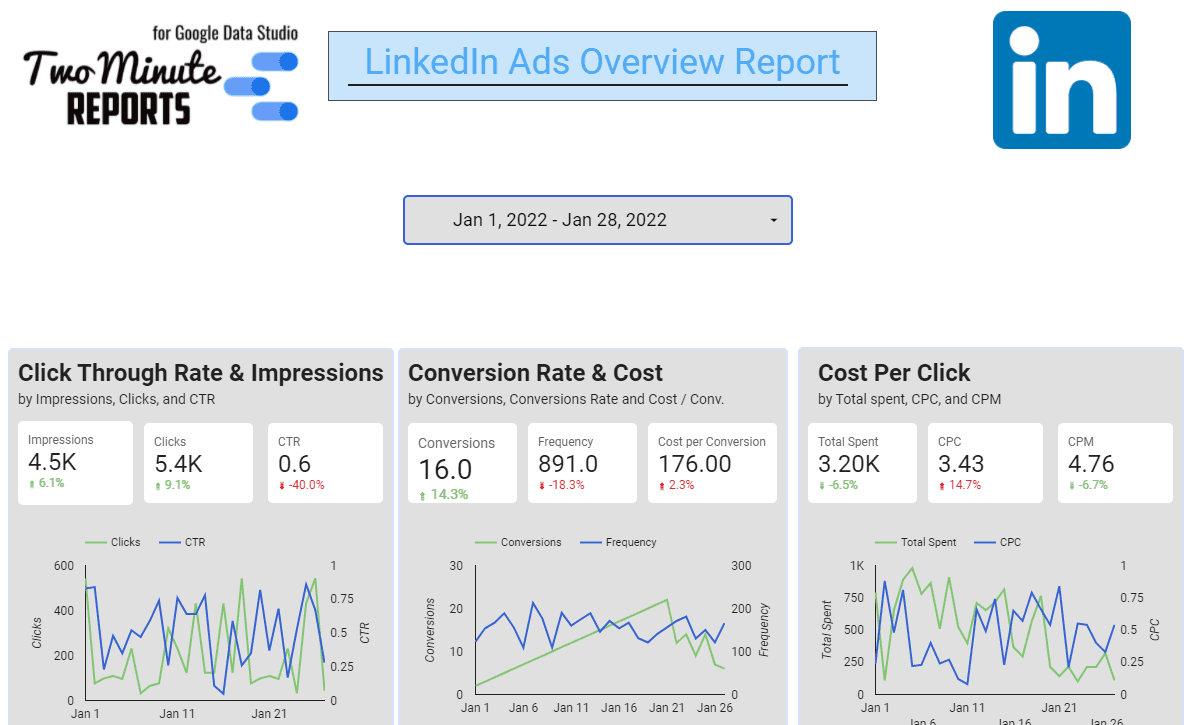
LinkedIn Ads overview
This is an interactive dashboard for monitoring LinkedIn Ads performance.
It includes dynamic charts that provide a detailed overview of your ads’ performance, including:
- Click-through rate
- Impressions
- Conversion rate
- Cost
- Cost per click
The top campaigns section lists campaigns based on:
- Amount spent
- Conversion
- Cost per conversion
The campaign type breakdown includes a pie chart for:
- Clicks
- Total spent
- Conversions
- Overall, this dashboard is designed to provide a comprehensive overview of LinkedIn Ads performance and help users keep track of their campaigns.
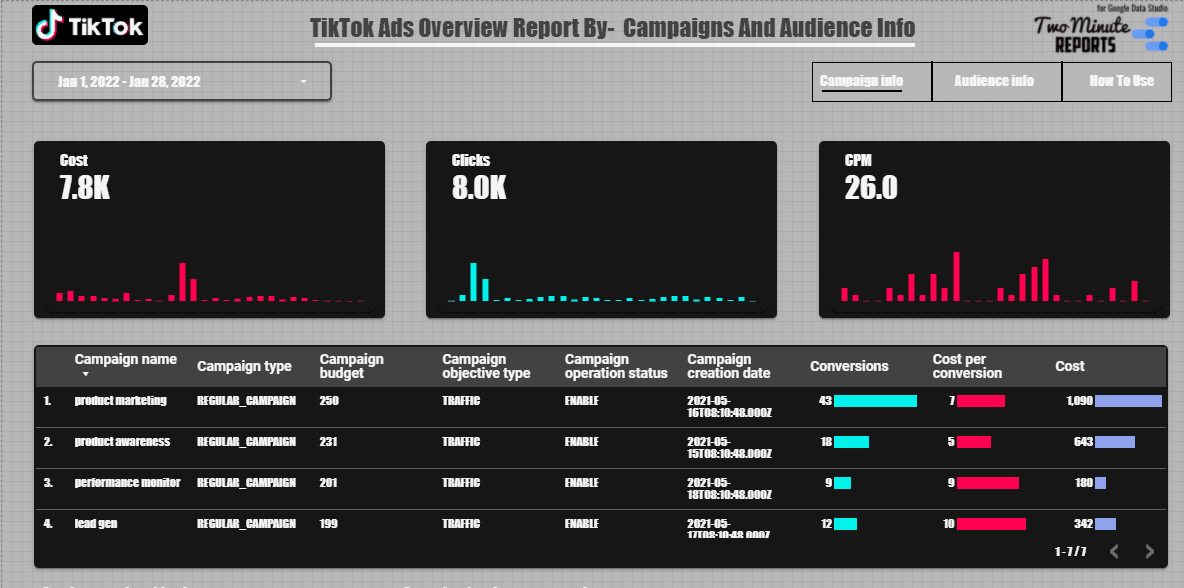
TikTok Ads Overview – Campaign and audience info
This template provides a detailed overview of the campaign and audience information for a specified date range.
- The campaign information section includes scorecards and time series charts for metrics such as cost, clicks, and CPM.
- It also provides detailed information about the campaign name, campaign type, campaign budget, campaign objective type, campaign creation date, conversion, cost per conversion, and total cost.
- The “Cost by Campaign Objective” section displays a pie chart of the total cost by campaign objective.
- The “Campaign Performance over Time” section monitors the performance of the campaign over a specific period.
The Audience Information section displays the following:
- Total number of impressions by gender
- Total number of impressions by device
- Total number of impressions by age group
- Total number of impressions for different Ad names
- Total number of impressions generated in different countries.
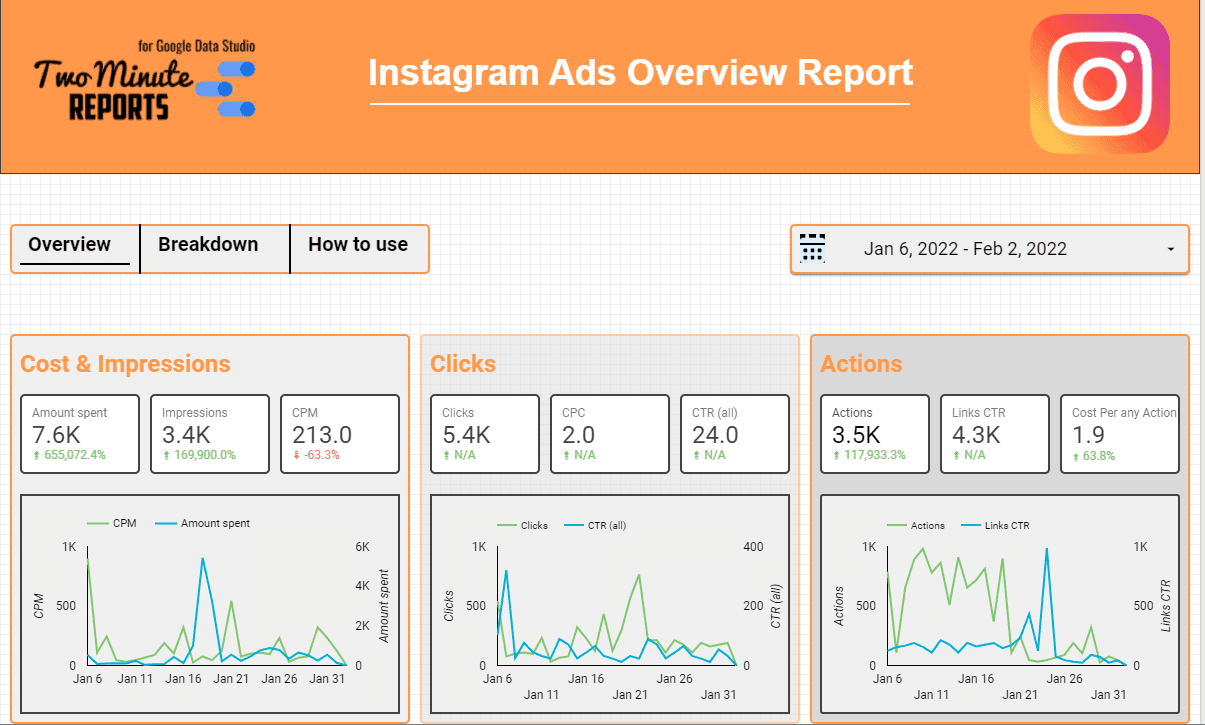
Instagram Ads Overview
This interactive dashboard provides an overview of data such as cost, impressions, clicks, and actions. You can monitor the performance of your Instagram Ads with this detailed template.
Overview:
- The dynamic charts offer a detailed overview of your Instagram Ads performance.
- The list of top campaigns is based on the amount spent, purchase (Roas), conversion ranking, and link (CTR).
- The country breakdown section shows the total number of conversions in each country.
Breakdown:
- The device breakdown section provides information about the amount spent, clicks, conversion ranking, and links CTR using different devices.
- The age breakdown section shows the number of people in different age groups based on actions.
- The gender breakdown section provides an idea about the total number of actions performed by different genders.
- The campaign objective breakdown section contains the total amount spent, cost per action, conversions, unique links CTR, impressions, and link clicks for different campaign objectives.
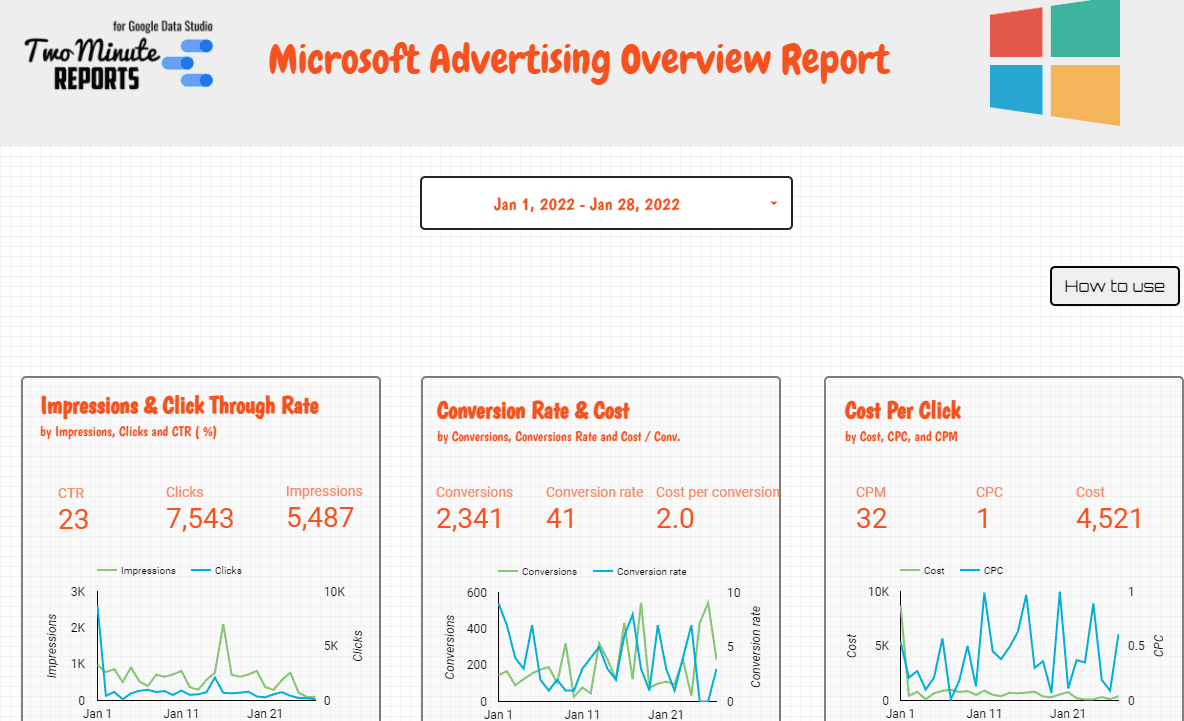
Microsoft Ads Overview
This template provides an overview of the following metrics for your review:
- Impression and click-through rate: This section monitors metrics such as CTR, clicks, and impressions using dynamic scorecards and time-series charts.
- Conversion rate and cost: This section tracks metrics such as conversion, conversion rate, and cost per conversion, also using dynamic scorecards and time-series charts.
- Cost per click: This section provides detailed information about CPM, CPC, and cost, again using dynamic charts and scorecards.
- Top campaigns: This section lists the top campaigns by clicks, cost, CPC, and conversions.
- Device breakdown: This section breaks down different devices based on the total number of clicks, cost, and conversions.
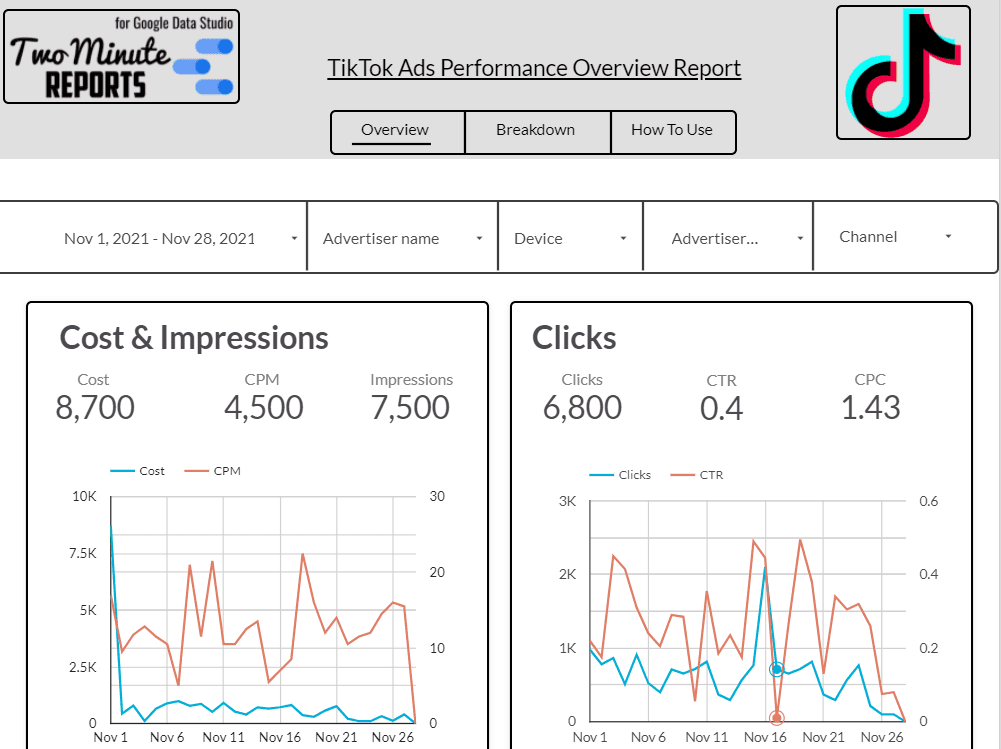
TikTok Ads Overview
This interactive dashboard provides an overview of data such as cost, impressions, clicks, and actions. You can keep track of your TikTok Ads’ performance with this detailed template, which includes:
Overview:
- Dynamic charts that provide detailed insights into your TikTok Ads’ performance.
- A list of top campaigns based on the amount spent, cost per result, and results.
- The country breakdown section, gives the total number of conversions in each country.
Breakdown:
- The device breakdown section, contains information about the amount spent, clicks, and impressions using different devices.
- The age breakdown section, which contains information about the number of people in different age groups based on their actions.
- The gender breakdown section, provides an idea about the total number of actions done by different genders.
- The campaign objective breakdown section, lists the total amount spent, cost per result, conversions, clicks, and impressions for different campaign objectives.
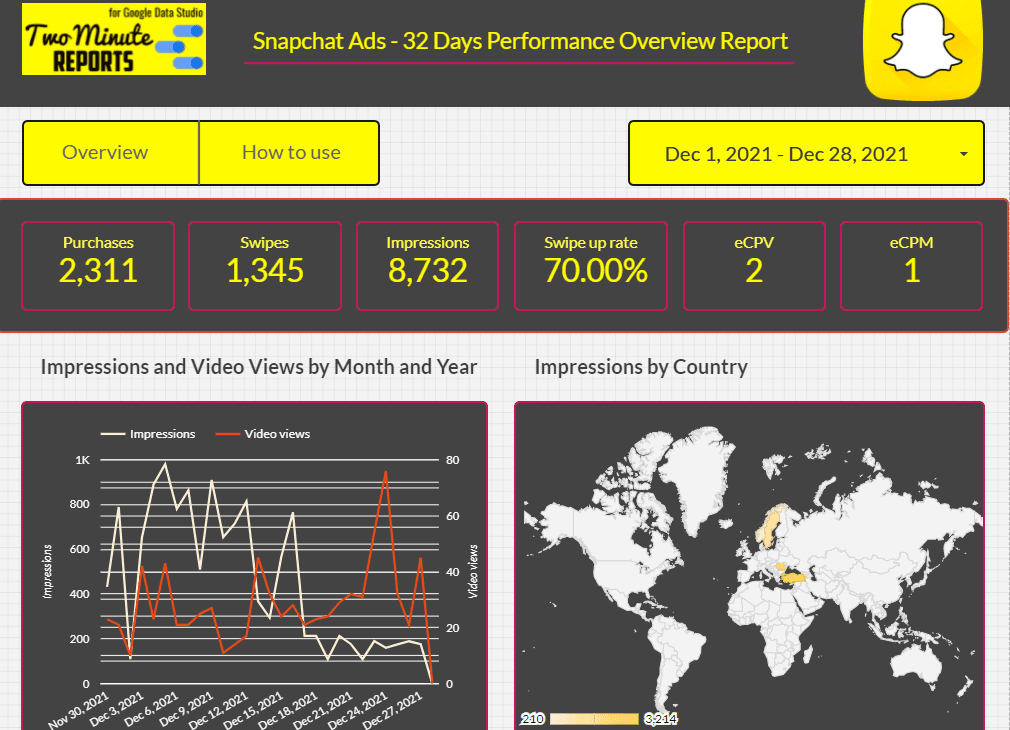
Snapchat Ads – 32 Days Performance Overview
This template provides a quick overview of your key Snap Ads metrics, including:
- Scorecard charts for different metrics, such as purchases, swipes, impressions, swipe-up rate, eCPV, and eCPM.
- A chart comparing impressions and video views by month and year.
- Impression by country: the total number of impressions observed in different countries.
- Impressions by gender: the total number of impressions made by different genders.
- Impressions by age: the total number of impressions made by people of different age groups.
- Top campaigns: a list of top campaigns based on campaign status, impressions, swipes, and conversion view content.
- Top ads: a list of top-performing ads by impressions, swipes, and conversion view content.
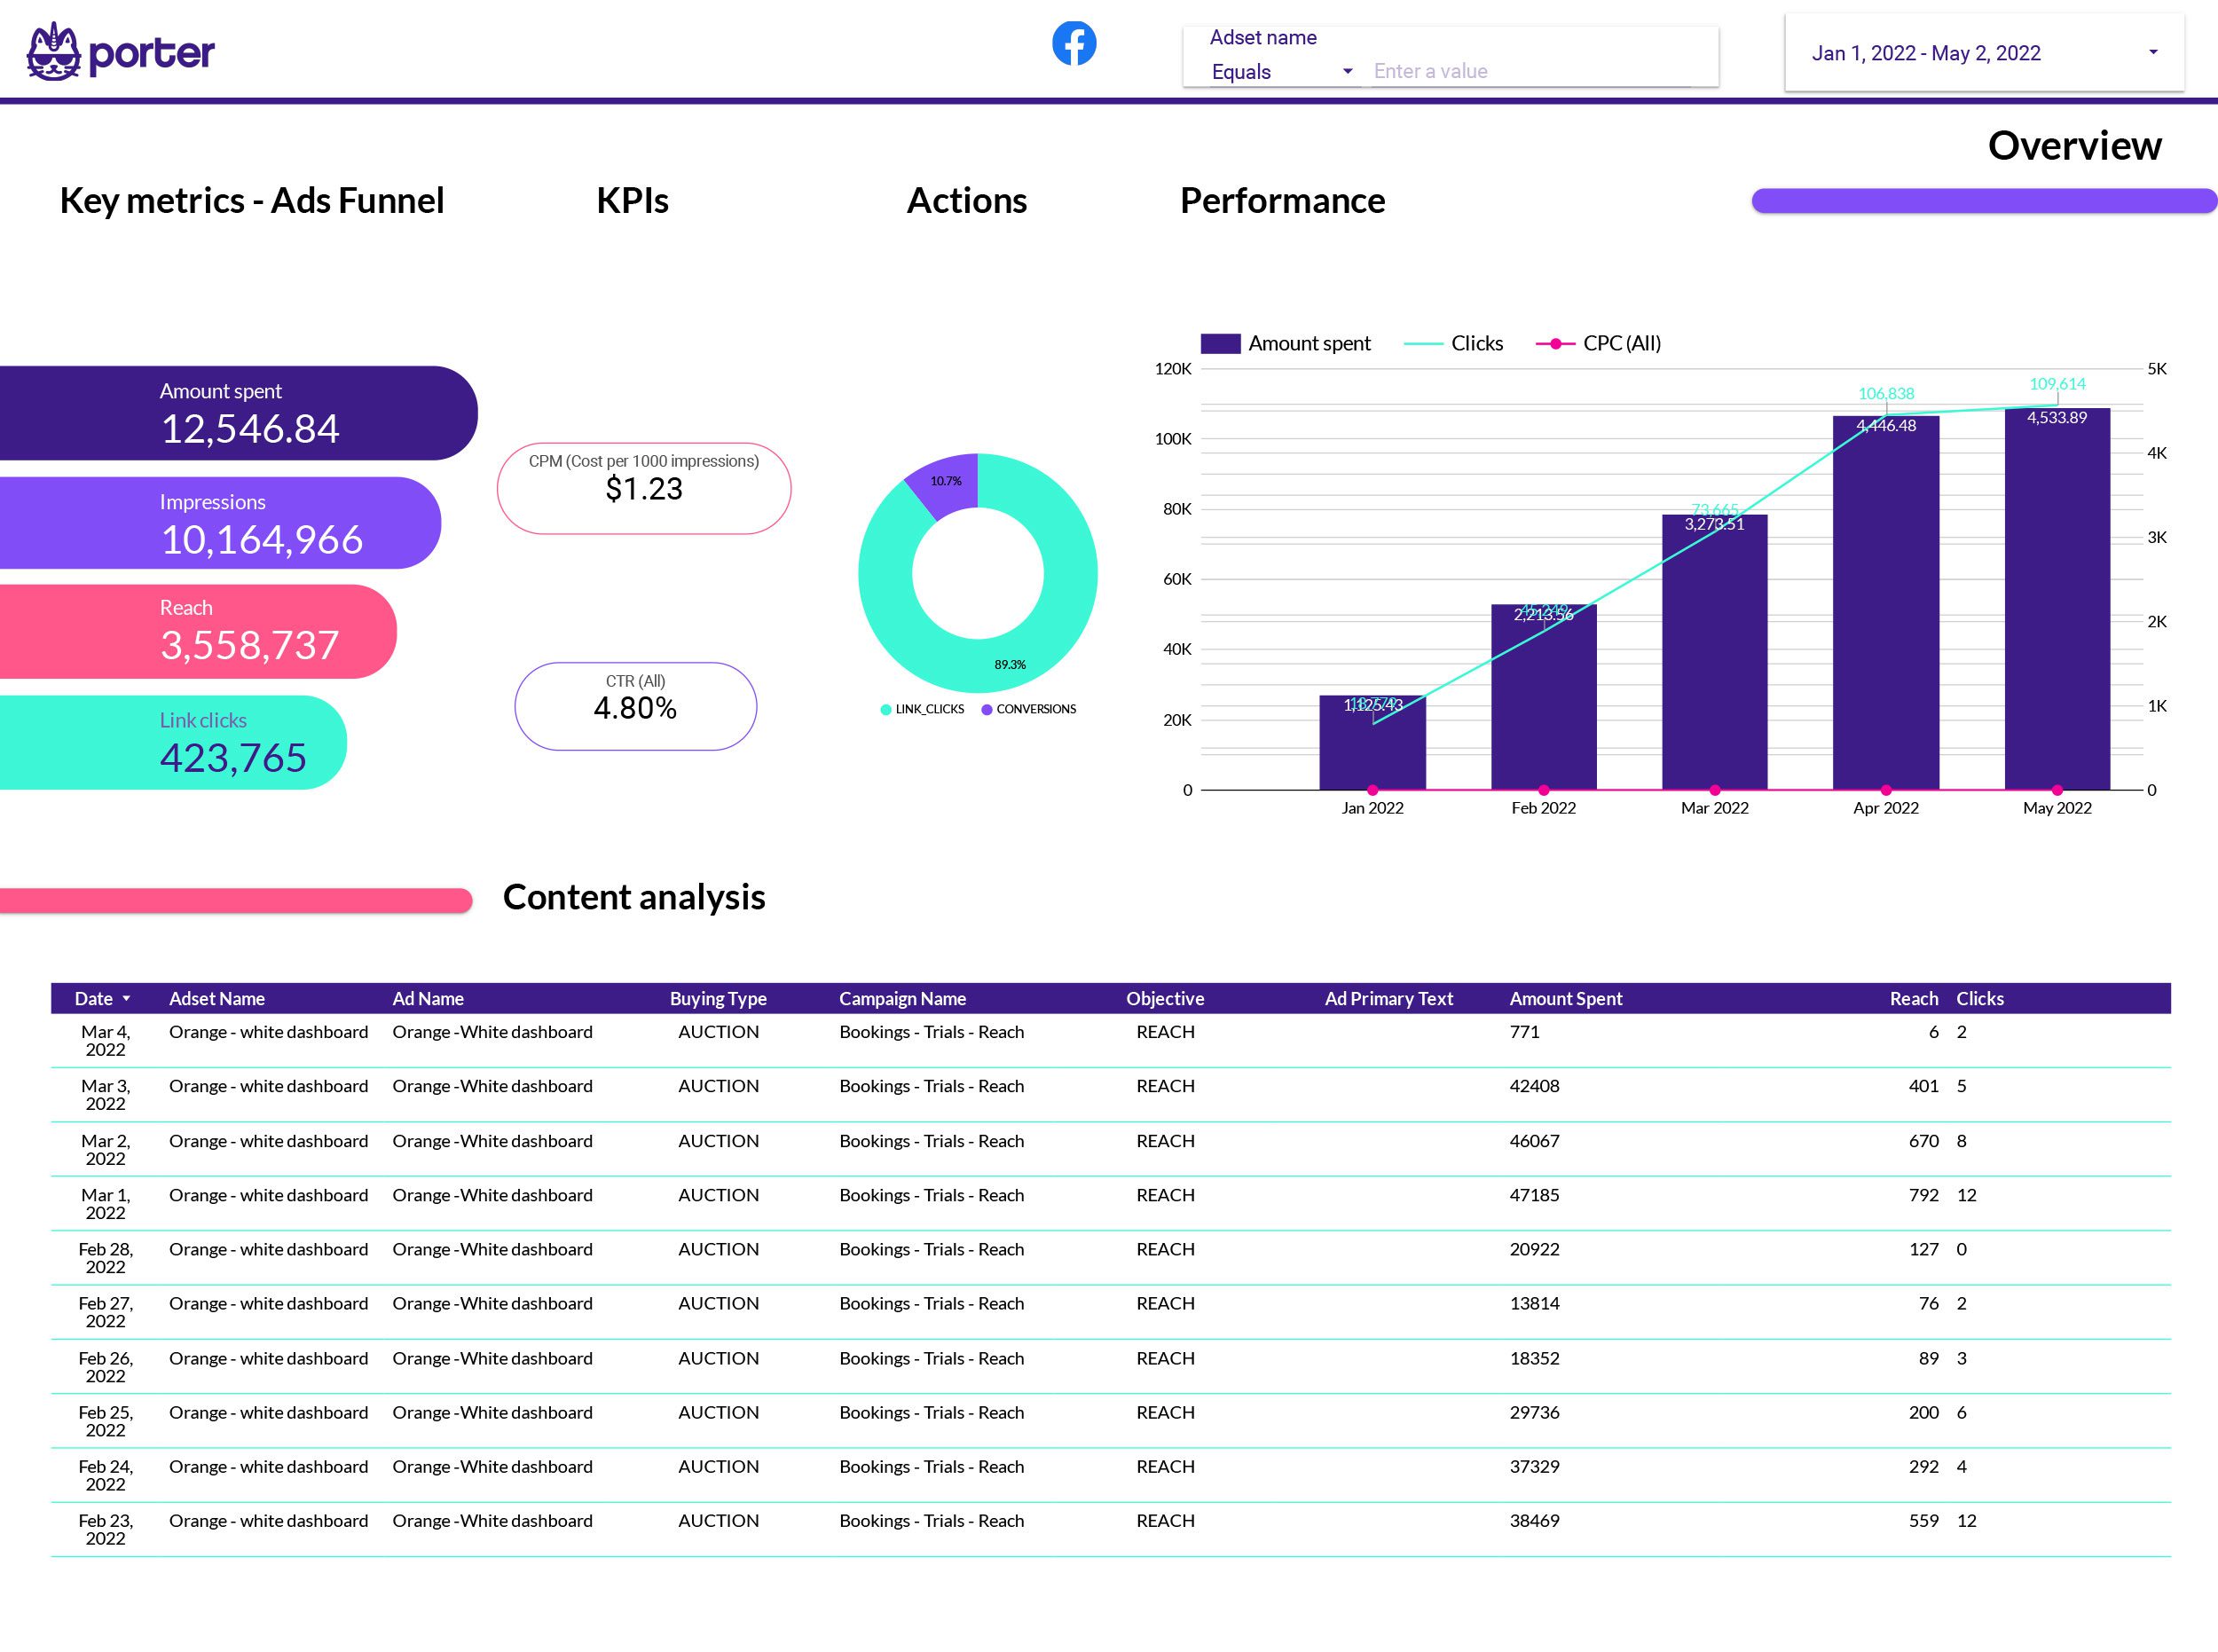
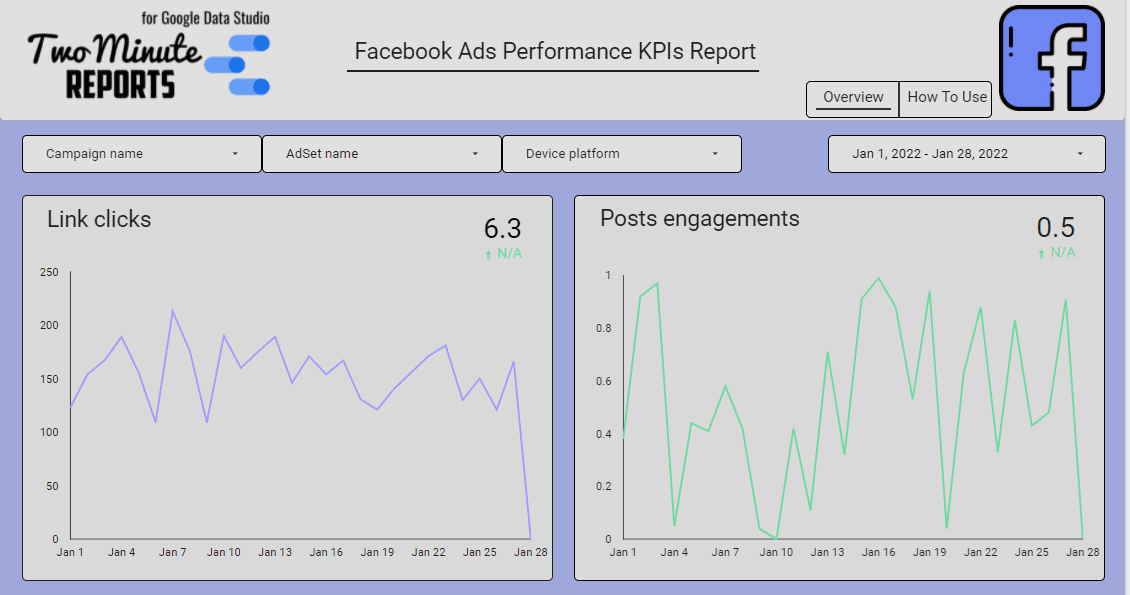
Facebook Ads Performance KPIs
This interactive dashboard helps you track the performance of your Facebook Ads by analyzing the following metrics:
- Link clicks: the number of clicks on your ad links.
- Post engagements: the number of interactions people have with your ads, such as likes, shares, and comments.
- CTR (Link): the effectiveness of your ads, expressed as the percentage of times an ad is seen and clicked.
- CPC (Link): the average cost you pay per click.
- Frequency: the average number of times a user sees your ads, calculated by dividing impressions by reach.
- CPM: the average cost to get 1000 impressions, which expresses the cost of your advertising to reach a specific audience.
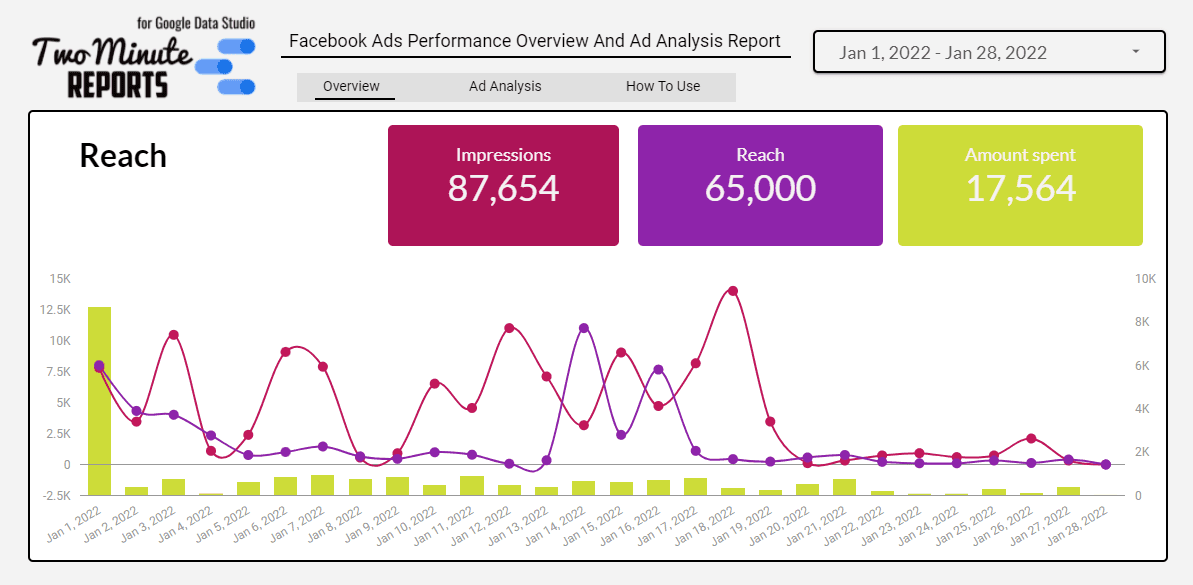
Facebook Ads Overview and Ad Analysis
This template provides a comprehensive overview of Fb Ads performance and analyzes their impact. It provides an overview of overall reach by comparing impressions, reach, and amount spent. It also offers a detailed report on total results by comparing clicks and the amount spent.
In addition to this, it monitors overall performance by comparing CPM, CPC, CTR (all), and the amount spent. The Ad analysis section further scrutinizes Ad performance by analyzing the amount spent, landing page views, action values, frequency, clicks, impressions, and reach.
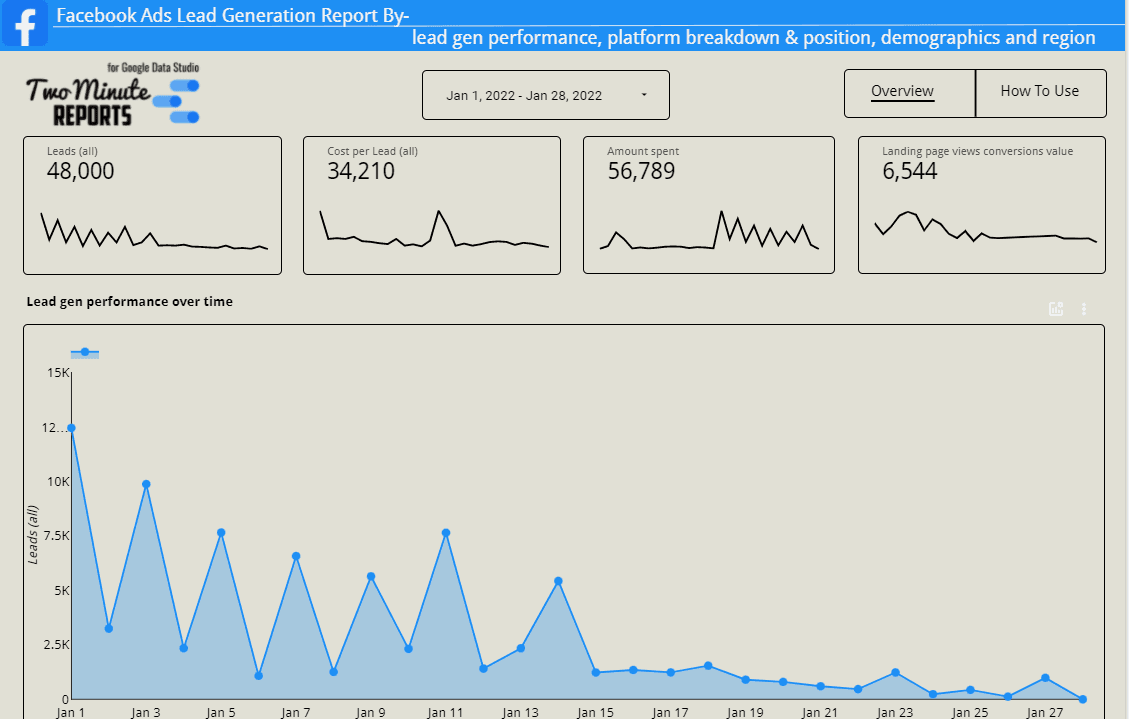
Facebook Ads Lead generation report by – lead gen performance,platform breakdown & position, demographics and region
This interactive dashboard uses the Lead standard conversion from Facebook Ads. It includes scorecard charts for leads (all), cost per lead (all), and amount spent. The dashboard helps you easily track your lead generation efforts with Facebook Ads. It provides a detailed overview of the best performing ads in terms of lead generation and cost per lead.
Additionally, it allows you to check which demographic audience is converting the most and which platforms and positions are driving the highest number of leads. Finally, you can discover which regions are driving the most leads geographically.
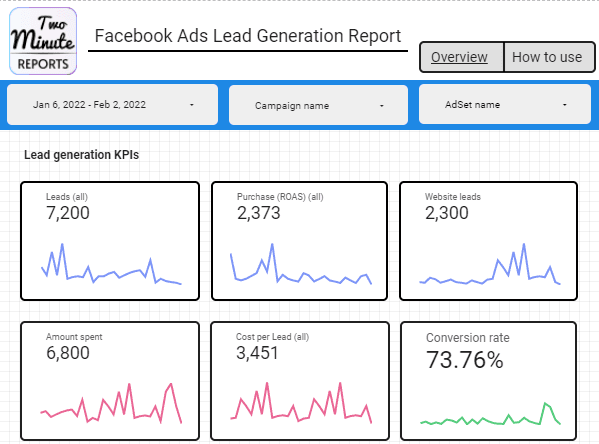
Facebook Ads Lead Generation
This interactive dashboard will help you track your lead generation with Facebook Ads on Looker Studio. It provides a clear picture of key KPIs, including:
- Total leads
- Amount spent
- Cost per lead
- Conversion rate
- Website leads
- Purchase ROAS (all)
The dashboard also highlights the best-performing ads, campaigns, and ad groups, as well as the top-performing devices and audiences.
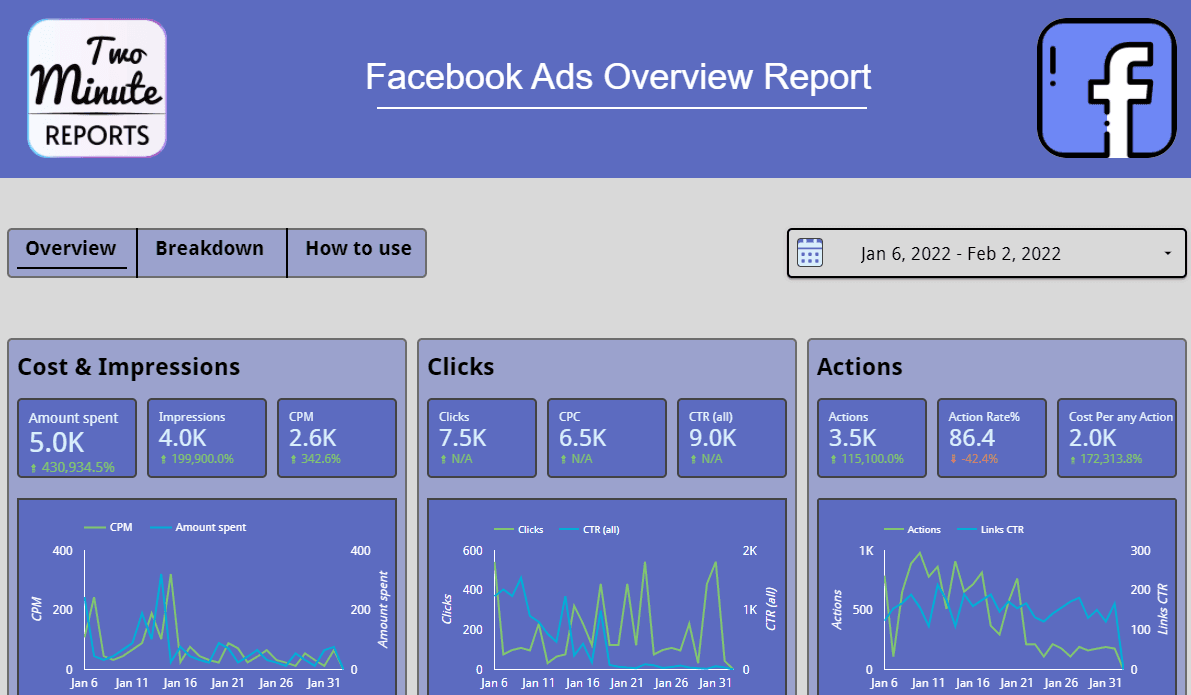
Facebook Ads Overview Report
This interactive dashboard provides an overview of data such as cost, impressions, clicks, and actions. You can track the performance of your Facebook Ads with this detailed dashboard template.
Overview:
- It contains dynamic charts that provide a detailed idea of your Facebook Ads’ performance.
- It lists the top campaigns based on the amount spent, purchase (Roas), conversion ranking, and link (CTR).
- The country breakdown section shows the total number of conversions in each country.
Breakdown:
- The device breakdown section contains information about the amount spent, clicks, conversion ranking, and link CTR using different devices.
- The age breakdown section provides information about the number of people in different age groups based on their actions.
- The gender breakdown section shows the total number of actions taken by different genders.
- The campaign objective breakdown section includes the total amount spent, cost per any action, actions, conversions, unique link CTR, impressions, and link clicks for different campaign objectives.
Free Looker Studio Templates for Facebook
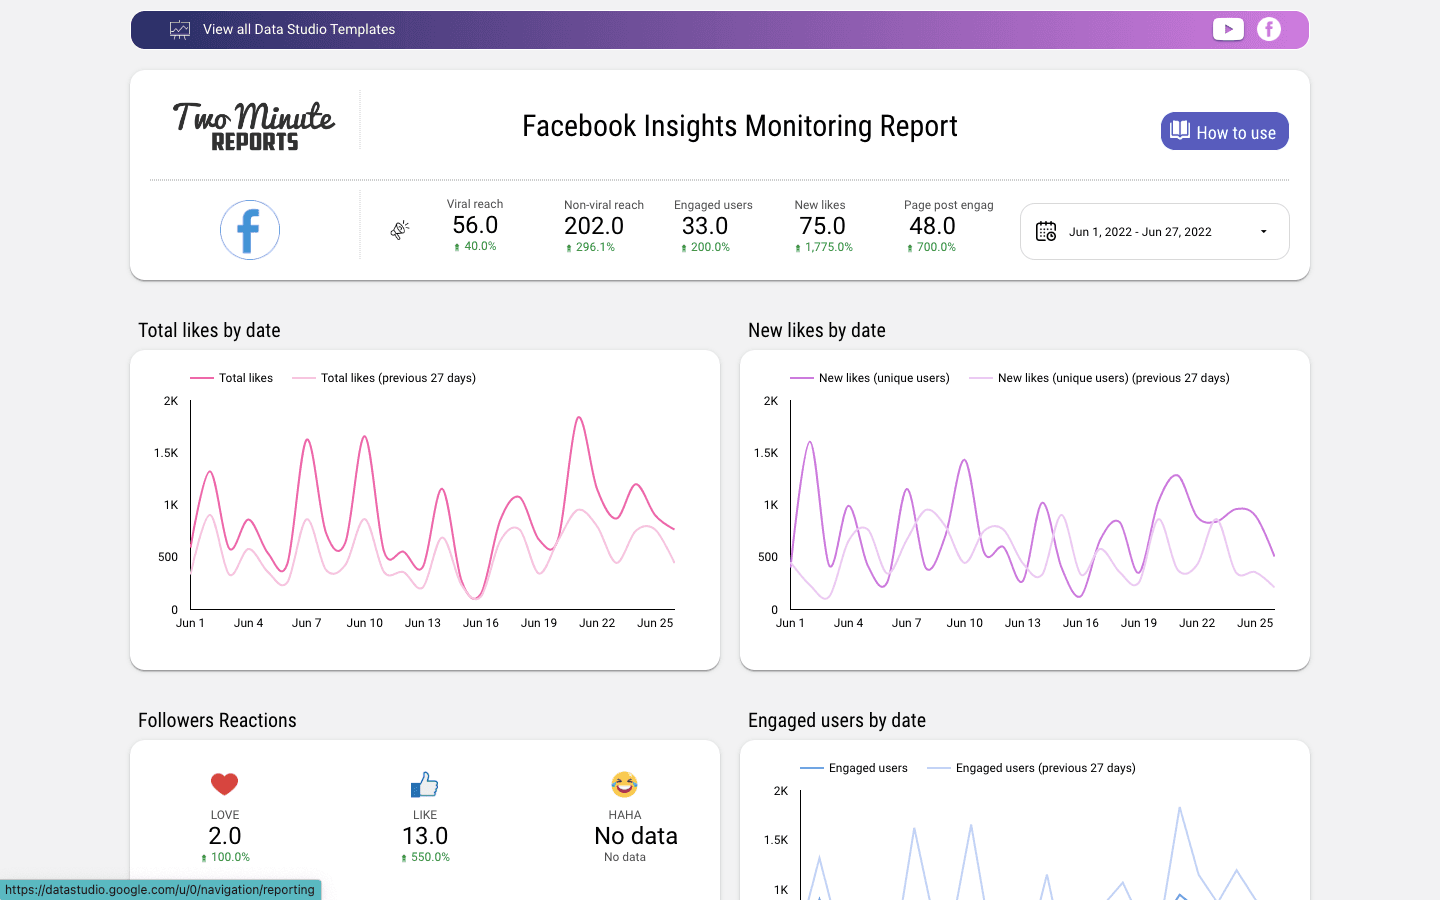
Facebook Insights Monitoring Report
Influencers, agencies, and brand marketers who regularly post informative and innovative content on Facebook can now monitor their content in real-time using this Insights Monitoring Report. You can analyze your Impressions, Followers, post insights, video insights, Geo location of your viewers, and more.
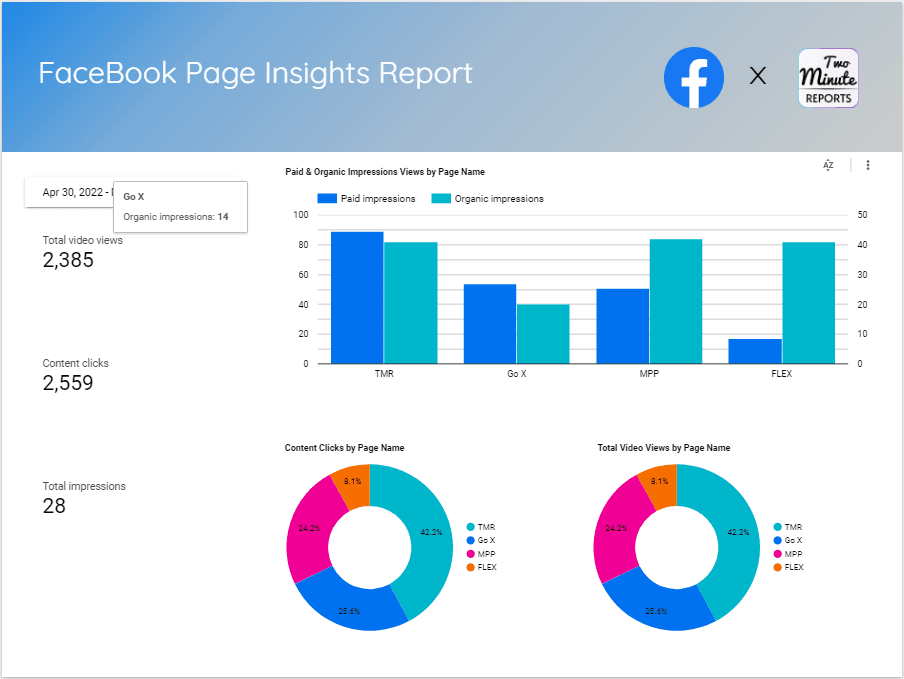
Facebook Page Insights Report
This interactive dashboard allows you to track various metrics such as video views, content clicks, and impressions for your Facebook insights. The template includes:
Overview:
- Scorecard charts show the total video views, content clicks, and impressions.
- A bar graph to compare paid and organic impressions for different pages.
- The country breakdown section gives the total number of conversions in each country.
Breakdown:
- The device breakdown section contains information about the amount spent, clicks, conversion ranking, and link CTRs using different devices.
- The age breakdown section contains information about the number of people in different age groups based on actions.
- Pie charts show content clicks and total video views for different pages.
- A bar graph shows engaged users for different pages, followed by scorecard charts showing the total numbers for different reactions.
The dashboard provides an overview of video data and more.
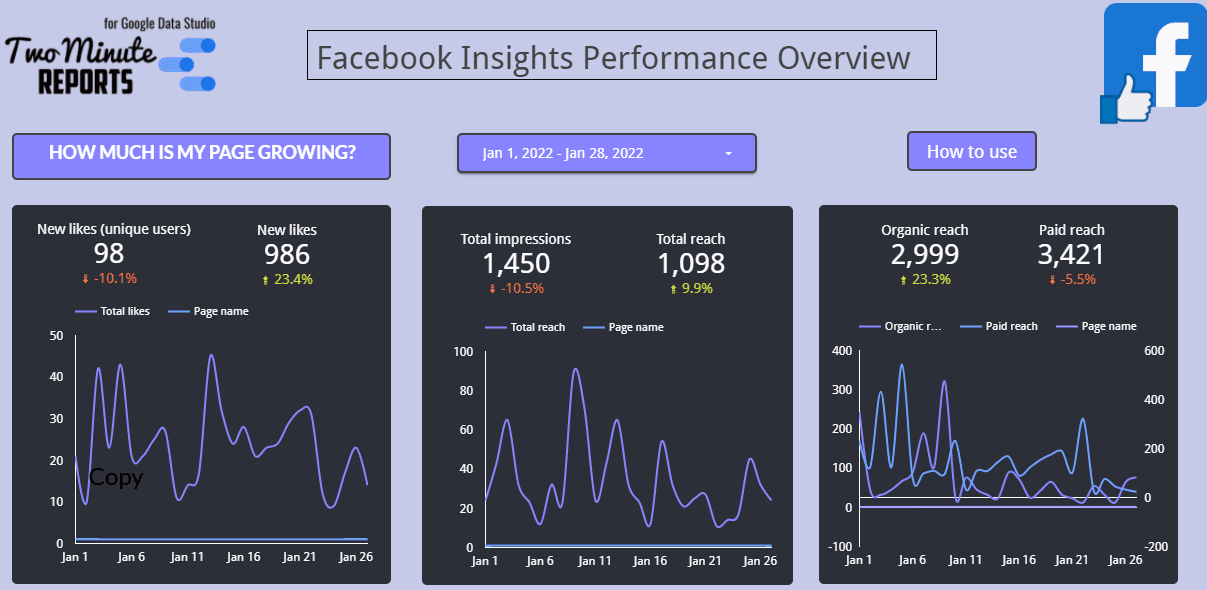
Facebook insight performance overview
This dashboard allows users to compare data from two months and includes important metrics such as total likes, new likes, organic reach, paid reach, total reach, impressions, page post engagements, and user reactions. The dashboard has three main sections:
- Page Growth: An interactive scorecard displays data for total likes, new likes, organic reach, paid reach, total reach, and impressions, along with dynamic charts.
- Audience Engagement: Dynamic charts show page post engagement and the total number of engaged users.
- User Reactions: Scorecard charts compare different user reactions, including love, wow, sad, and anger.
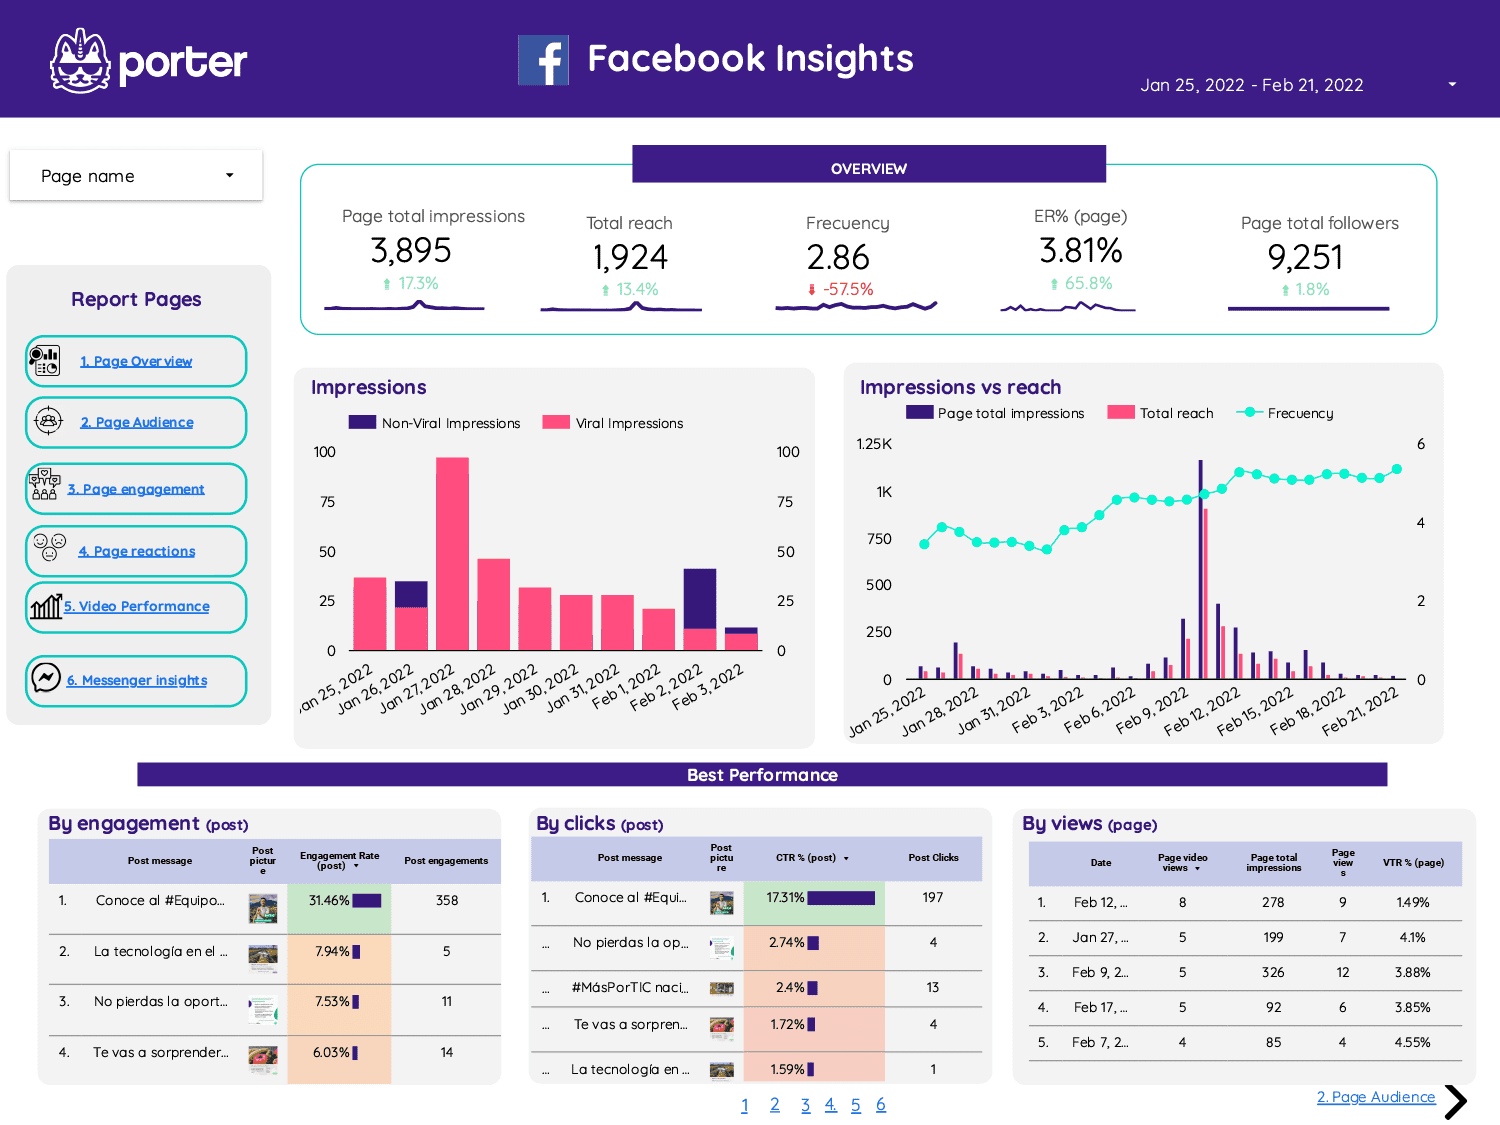
Facebook Insights Report Template
Are you looking for a Facebook Insights Report Template? Check out this Facebook Insights Report Template.
Free Facebook competitors analyzer
Are you looking for a Free Facebook competitors analyzer? Check out this Free Facebook competitors analyzer.
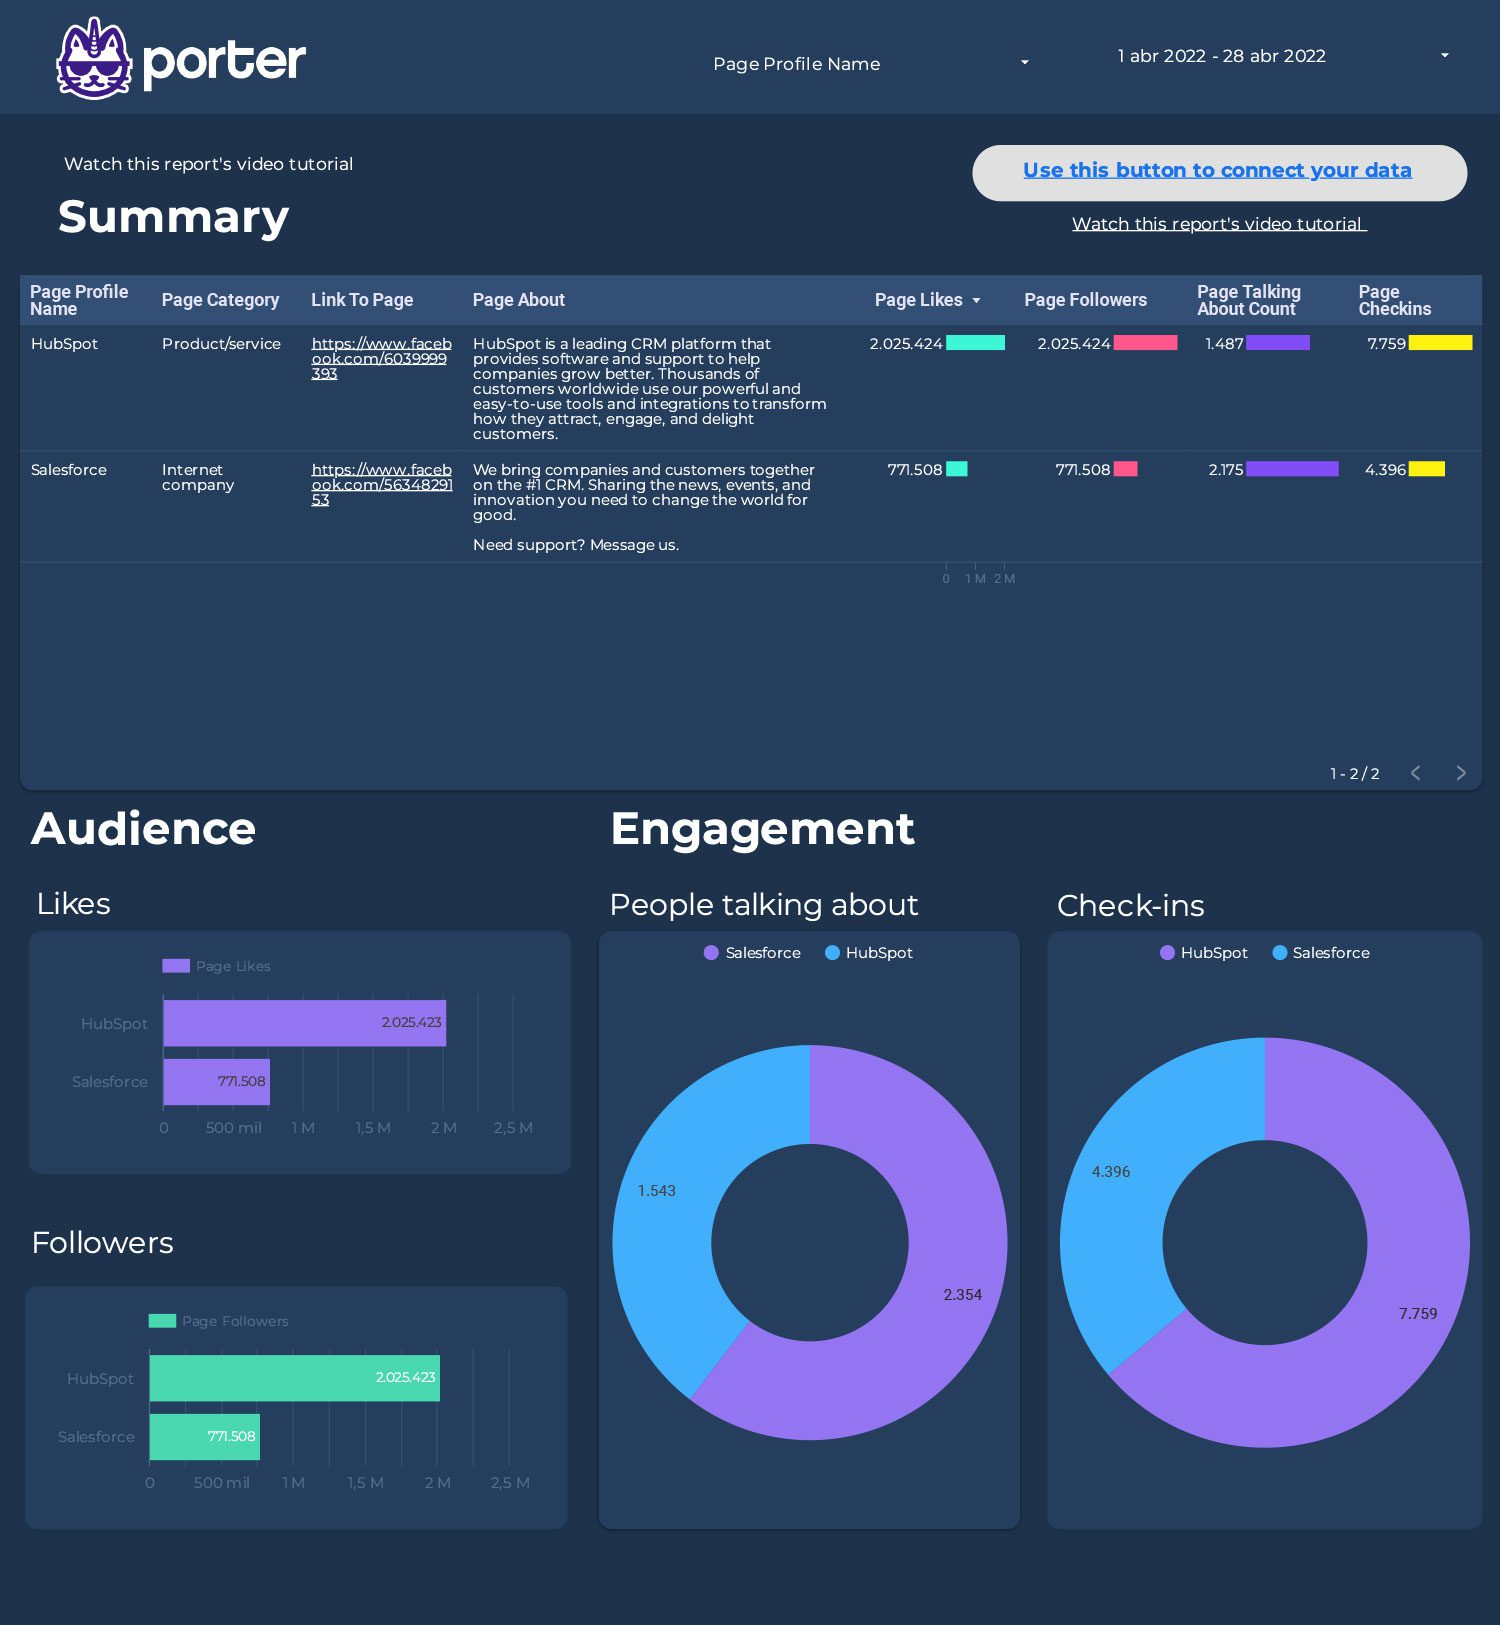
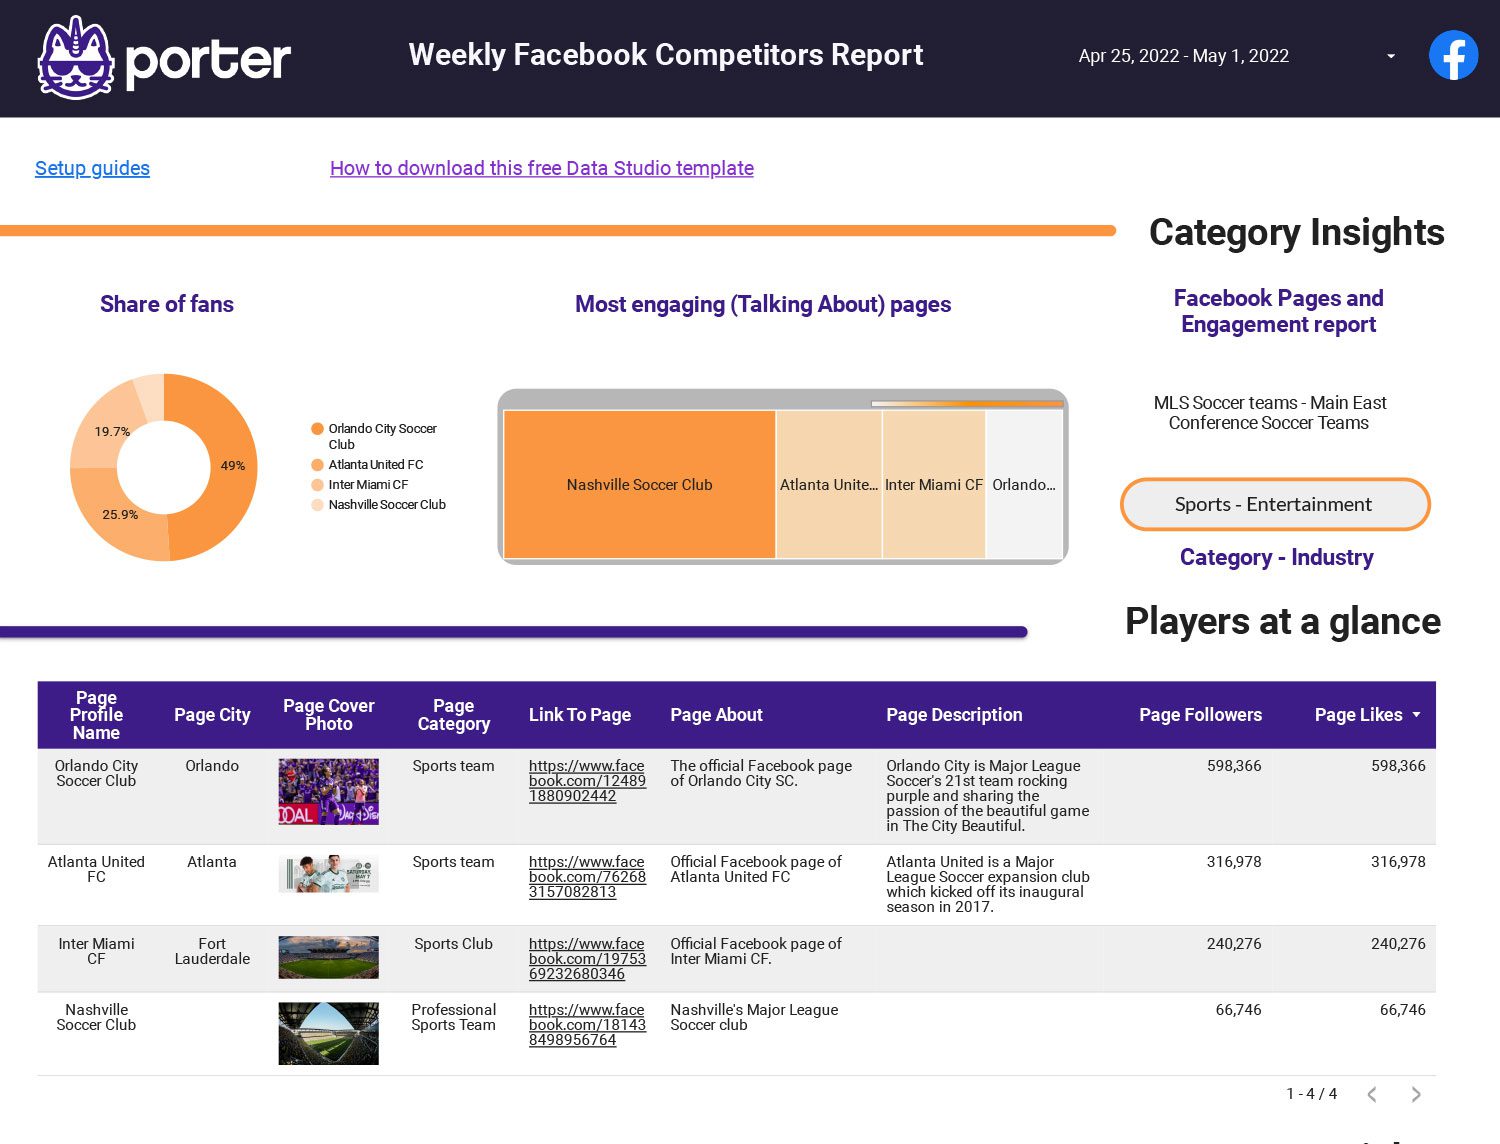
FREE Facebook Competitors report for Google Looker Studio
Download this report to visualize your Facebook Pages competitors. Pull data and create yours with this FREE Facebook Competitors report.
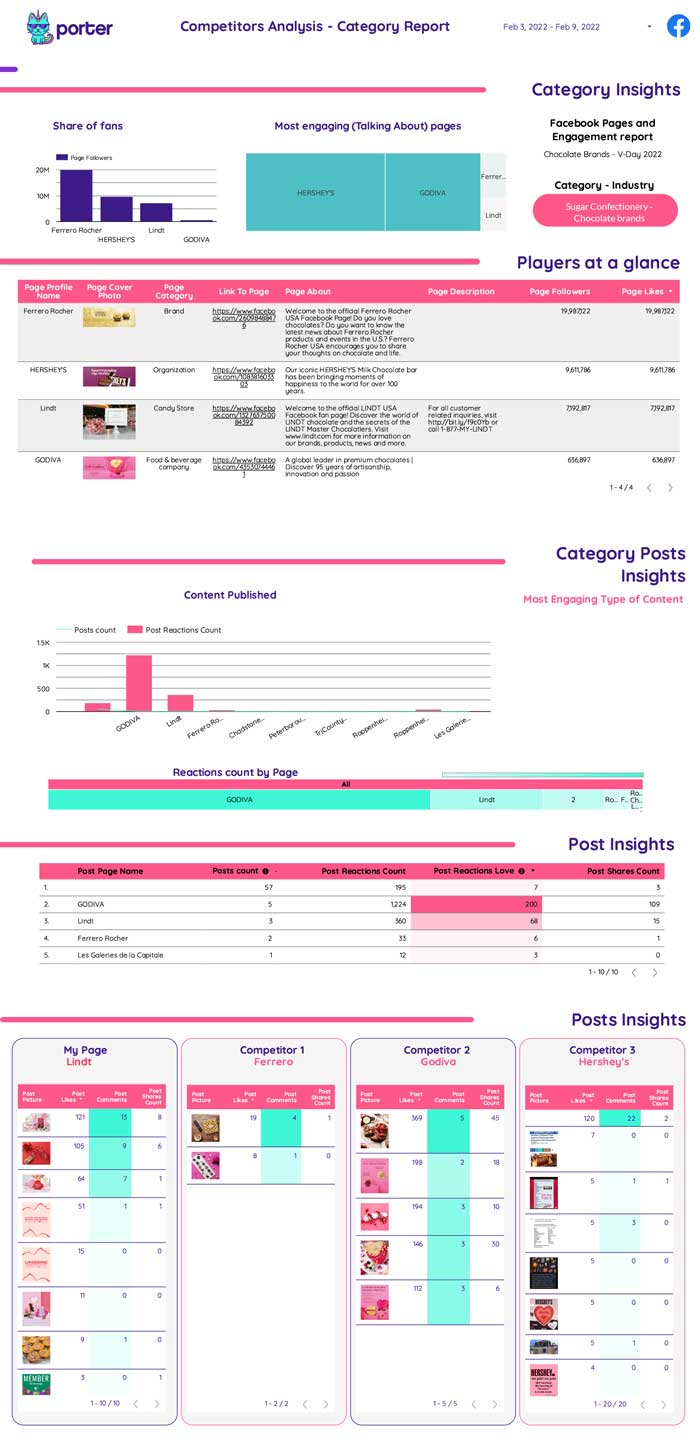
Mobile friendly Facebook Competitor’s Report for Google Looker Studio
Compare different Facebook Fan Pages in your product category or industry to understand the most relevant metrics regarding the community.
Instagram Free Looker Studio Templates
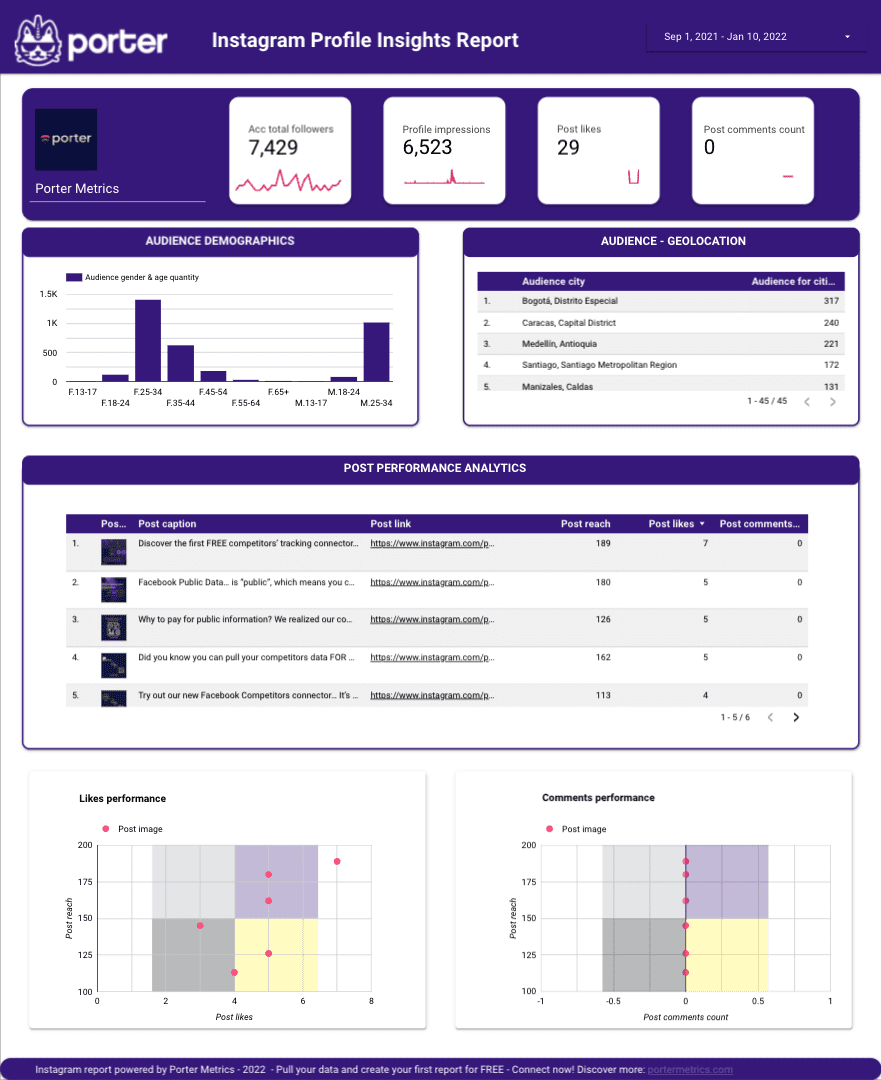
Instagram Insights Free Report
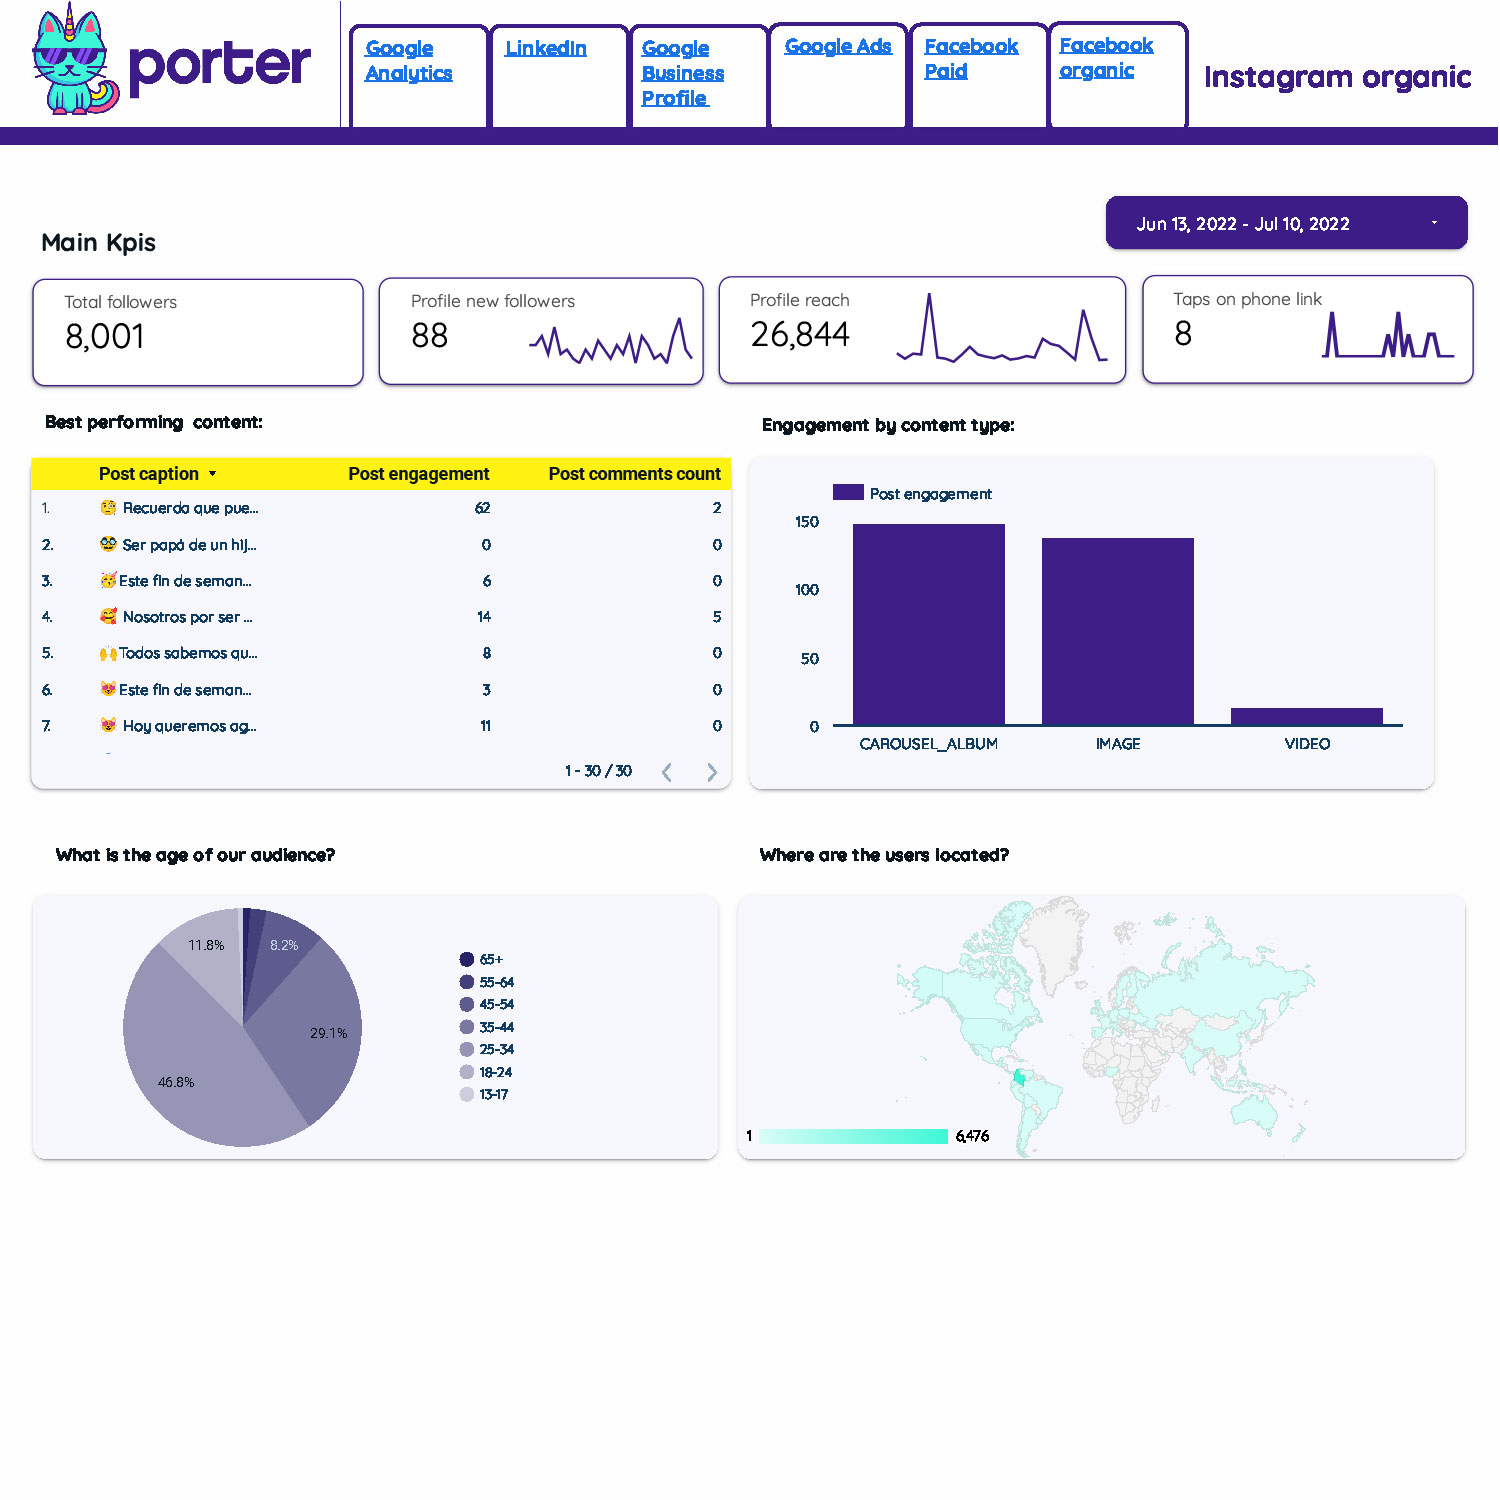
Influencers, agencies, and brand marketers who regularly post informative and innovative content on Instagram can now monitor their KPIs in real-time using this Insights Monitoring Report. It provides analysis of impressions, followers, story insights, post insights, and geo-location of views.

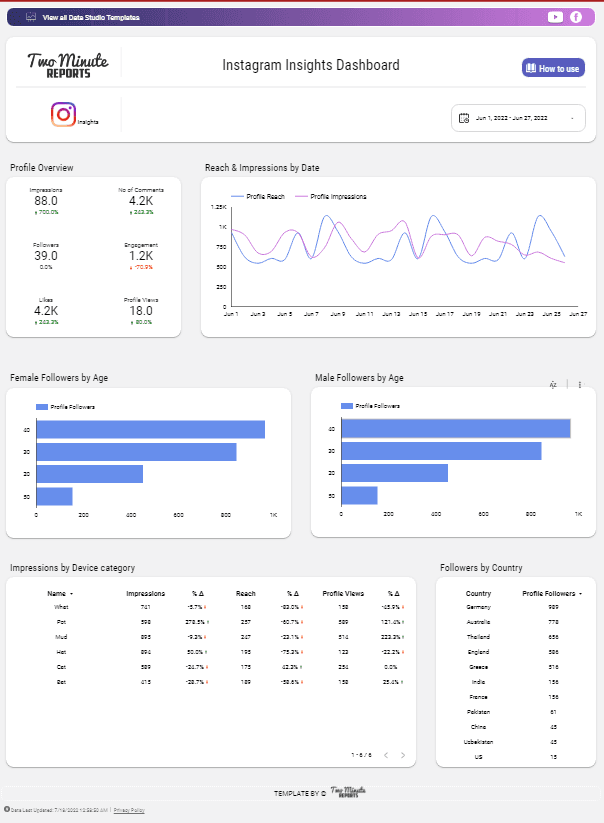
Instagram Insights Dashboard
Check your Instagram Insights quickly with this one-page template. It includes Profile Overview, Impressions by Date, Device, and Country, and Followers by Gender. See the preview for an exact look at the Looker Studio template.
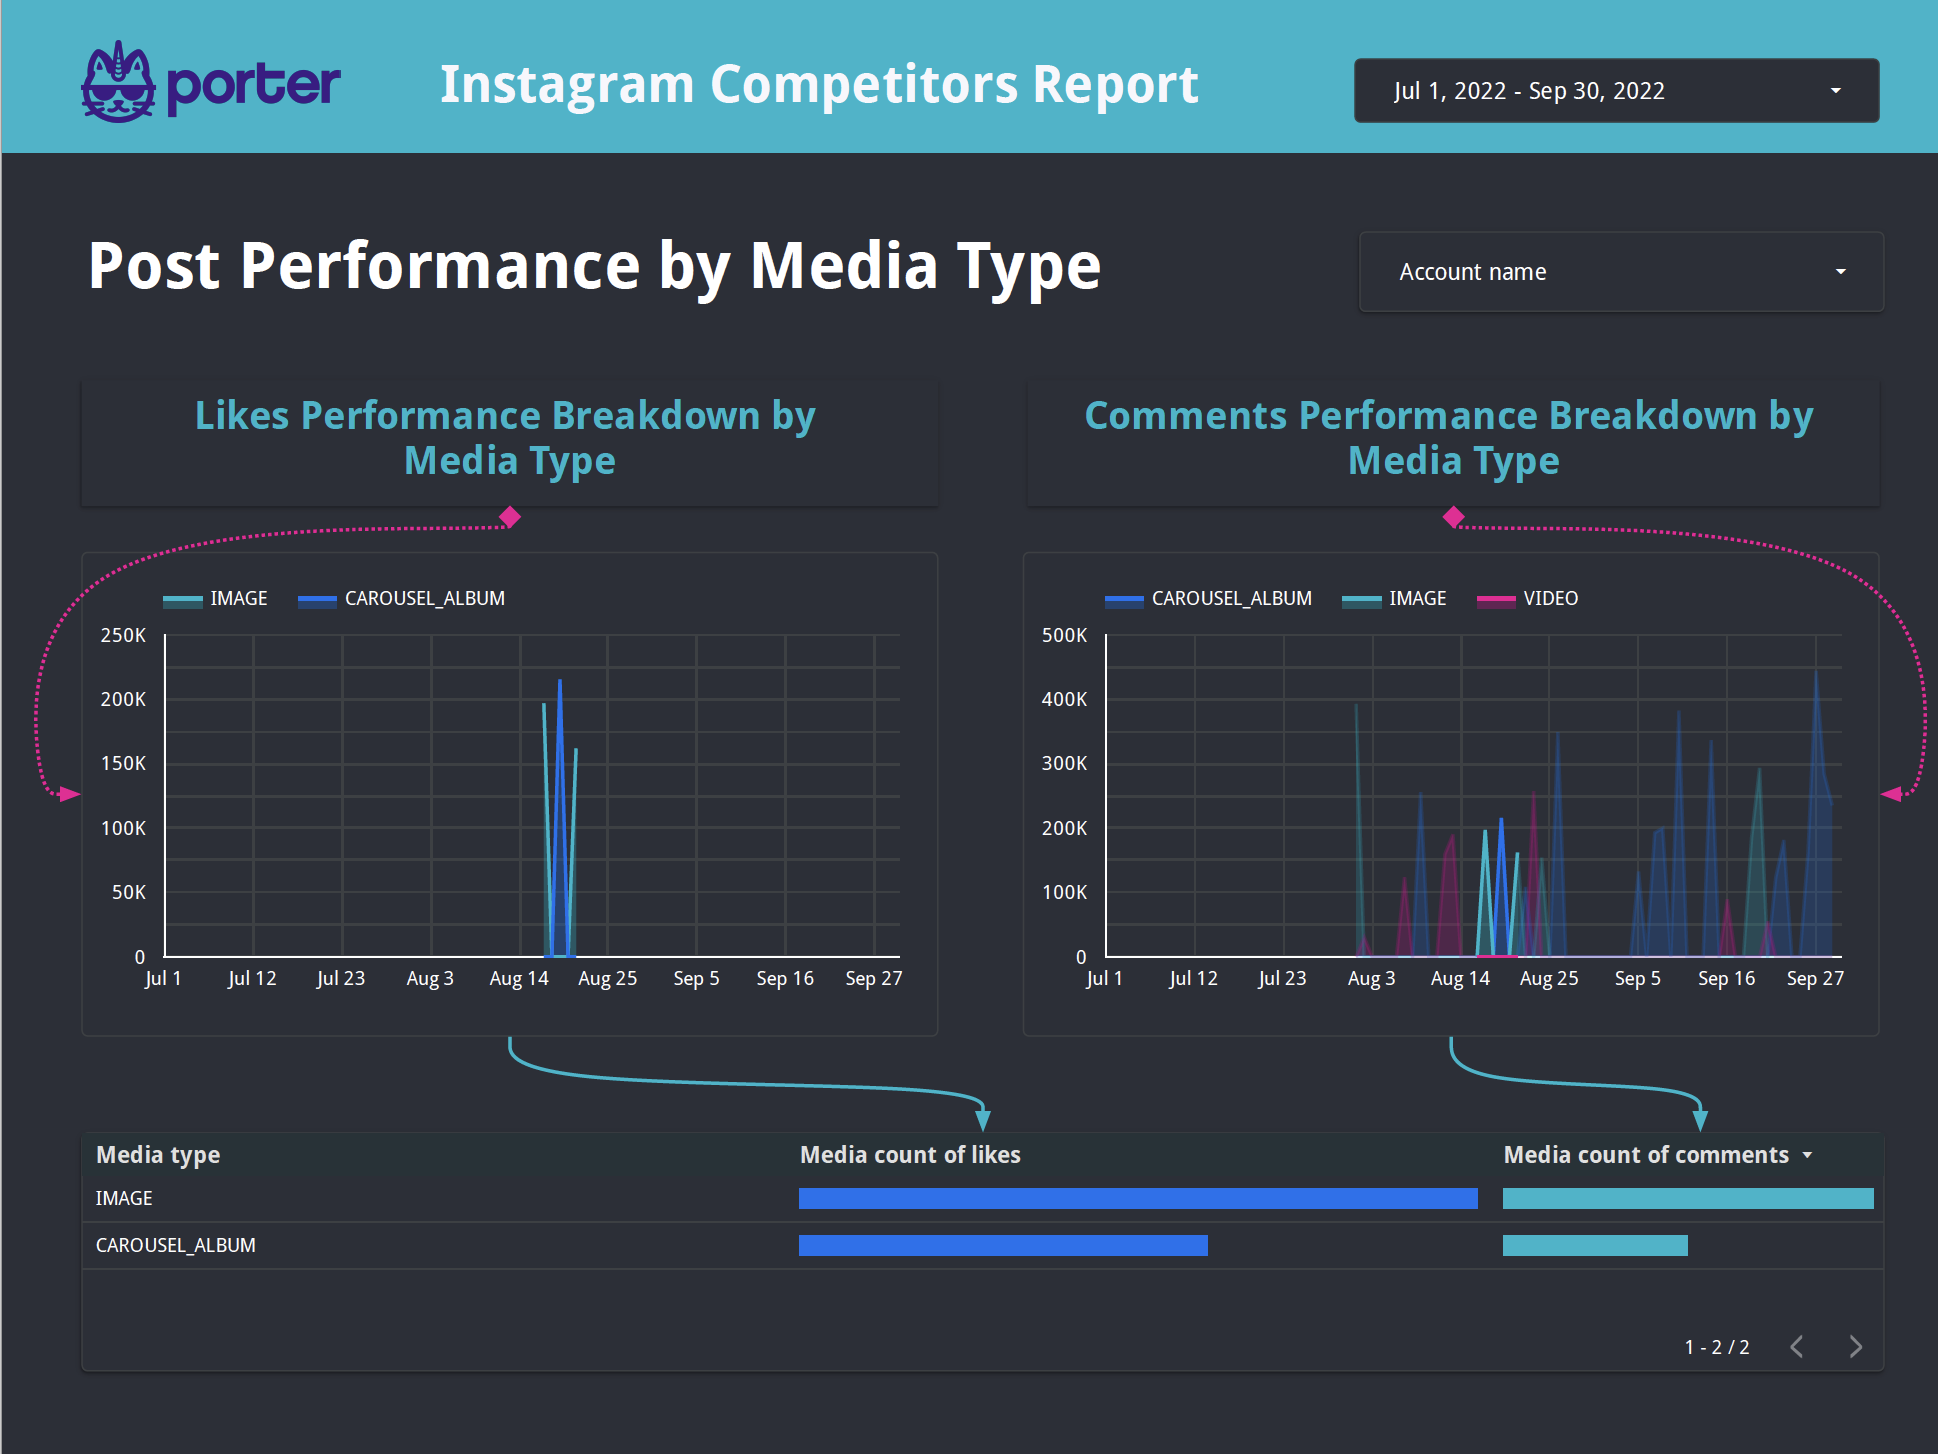
Instagram Competitor’s Report for Google Looker Studio
Are you looking for a Free Instagram Competitor’s Report? Check out this Free Instagram Insights report template.
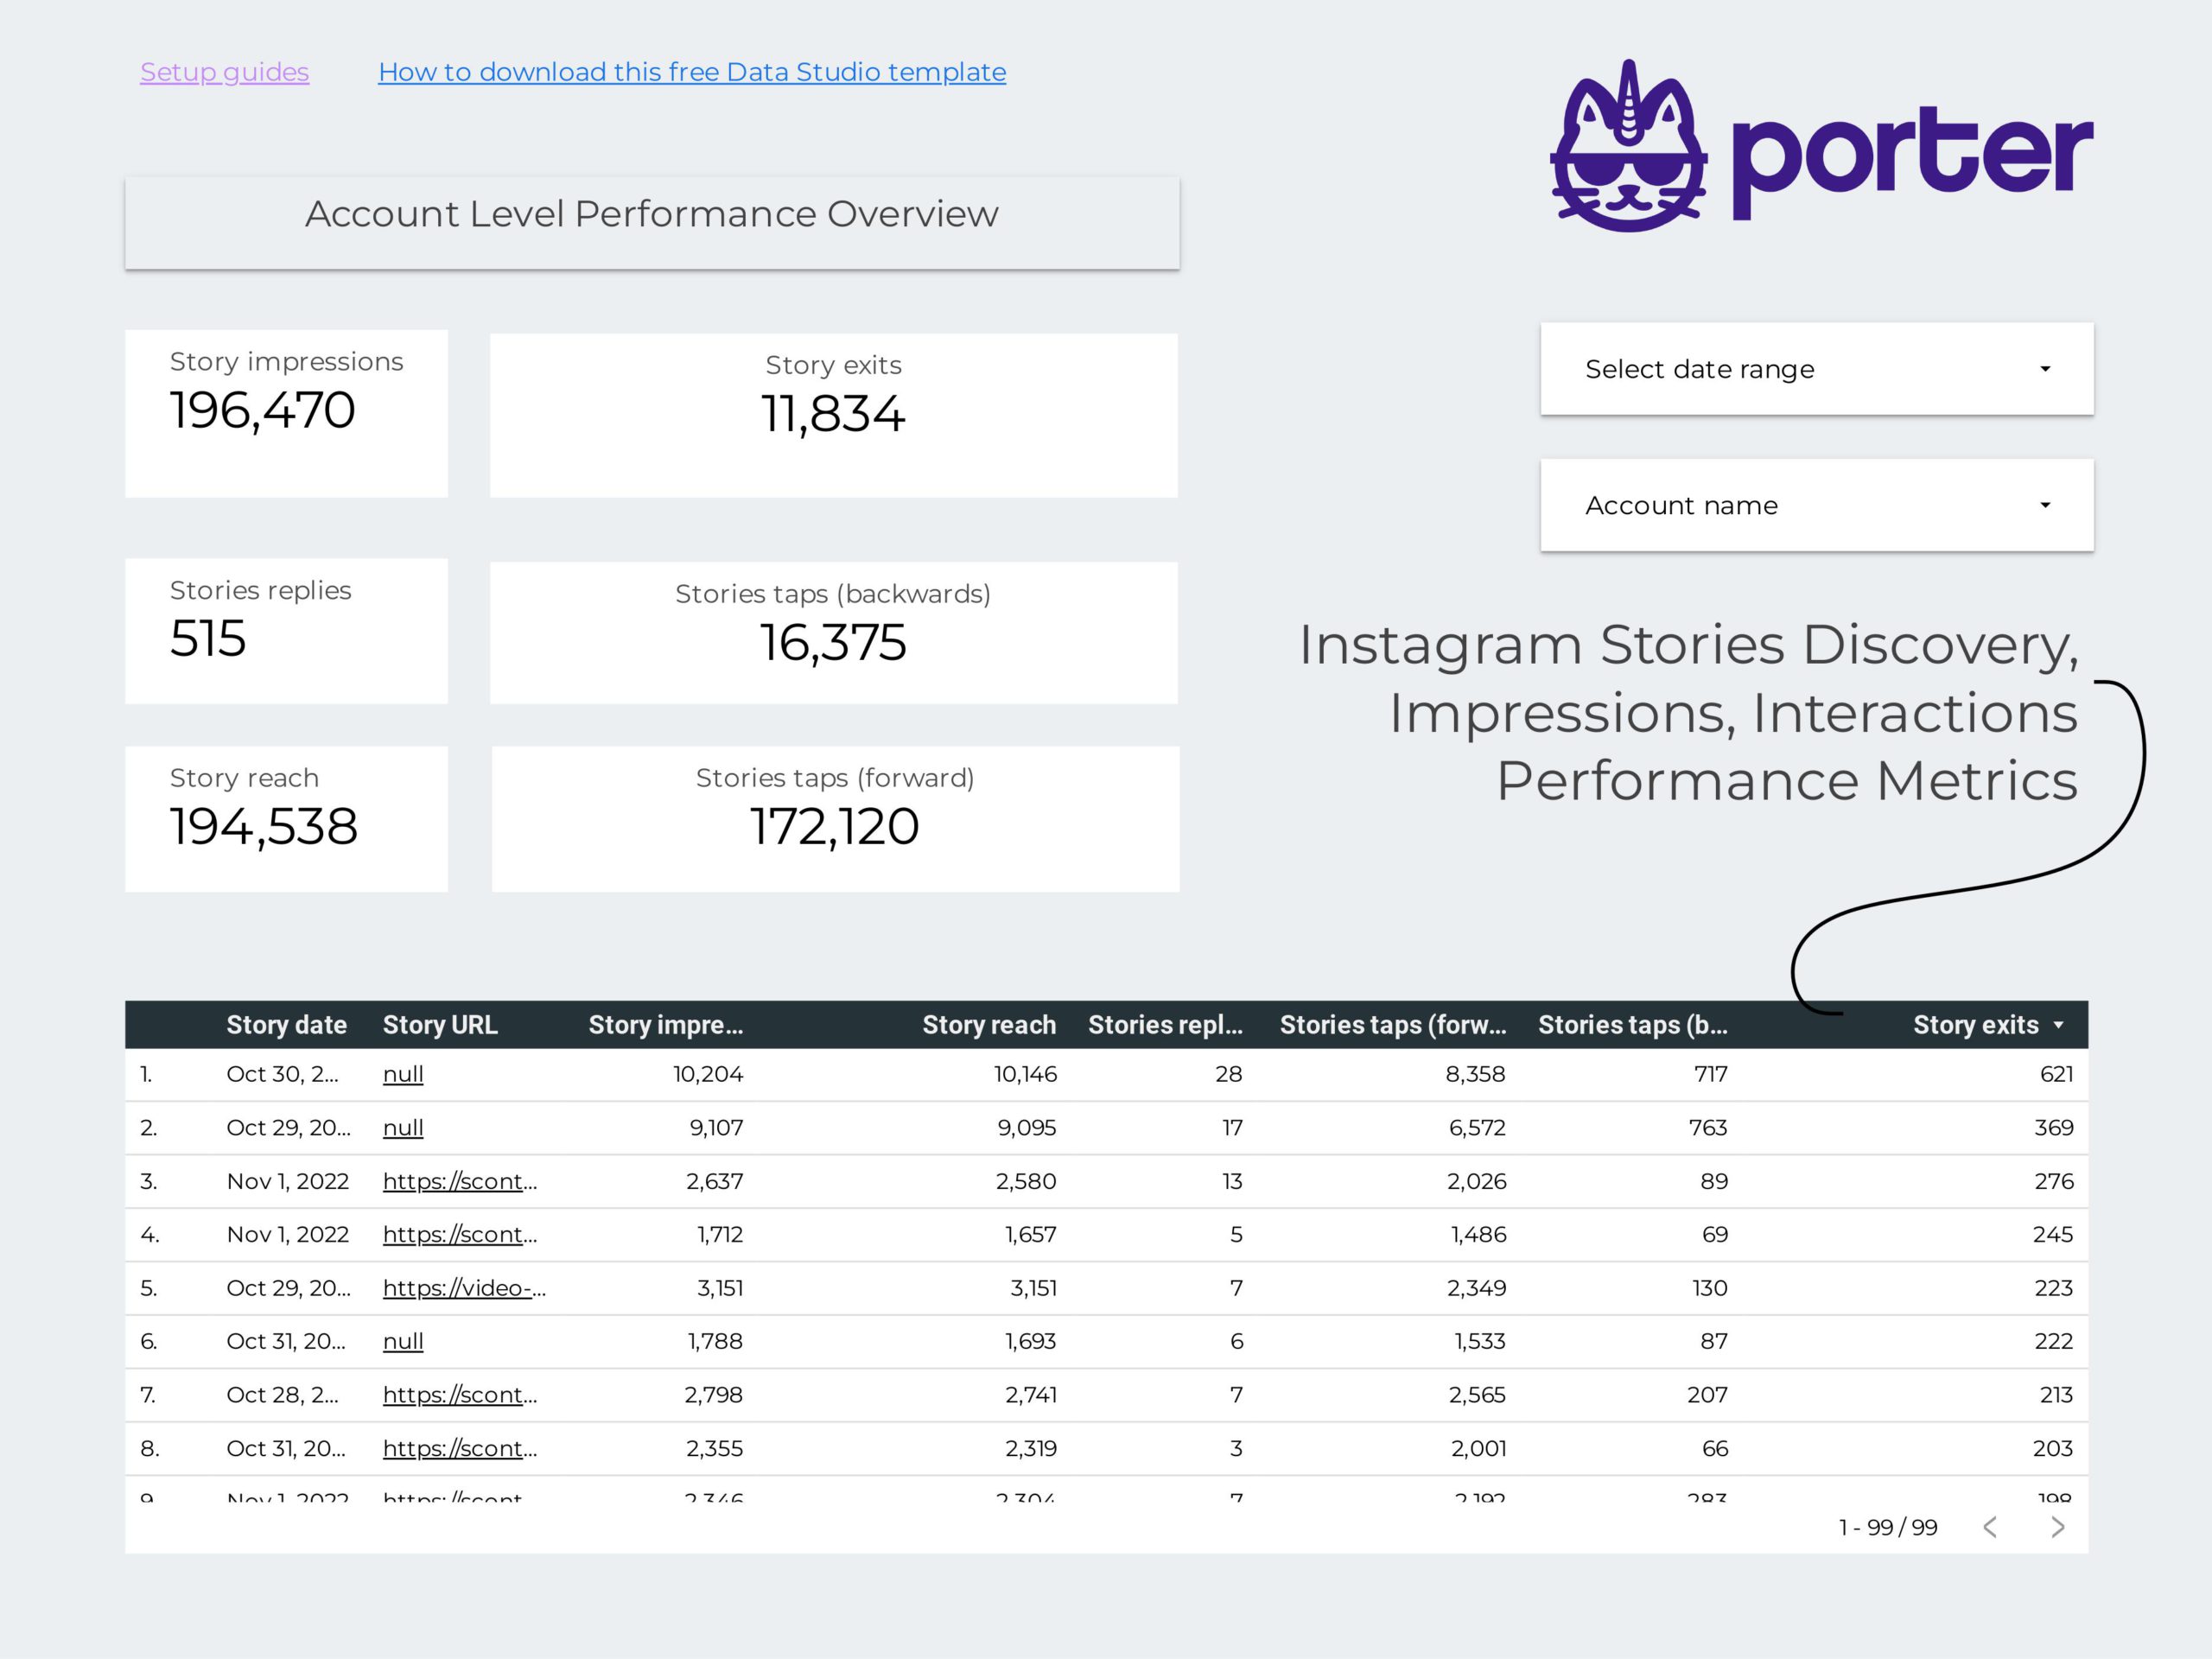
Instagram Stories Report Template on Google Looker Studio
Are you looking for a Free Instagram Stories report template? Check out this Free Instagram Stories report template.
Instagram Competitor’s Report for Google Looker Studio
Are you looking for a Free Instagram Competitor’s Report? Check out this Free Instagram Insights report template.
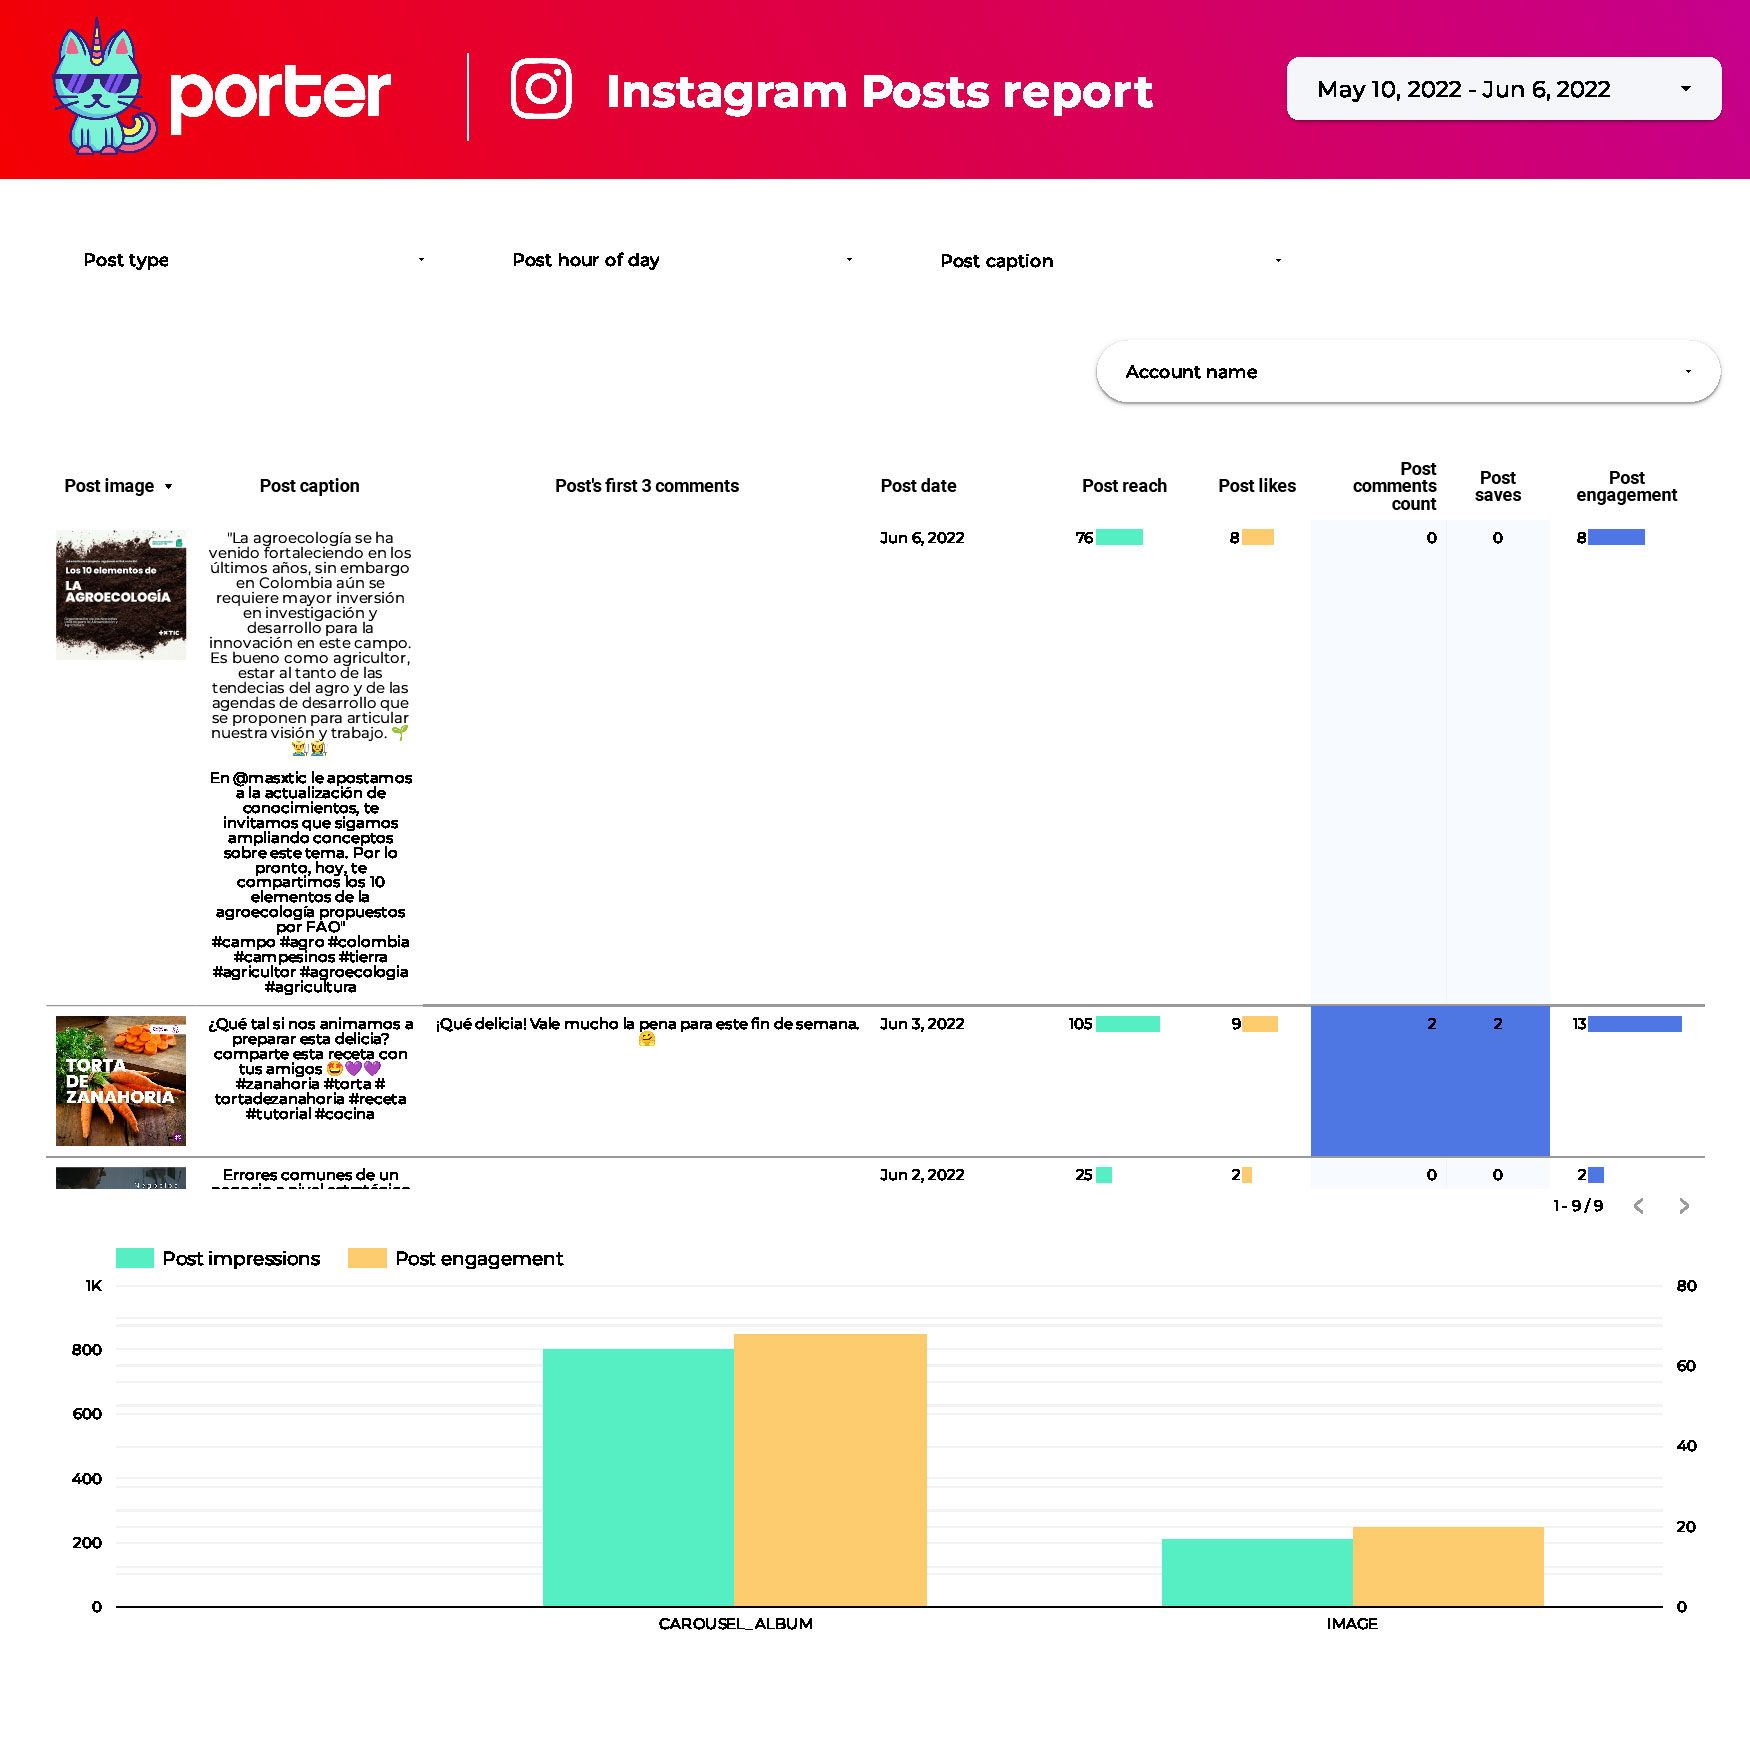
Free Instagram KPIs tracker template
Use our Instagram KPIs tracker template to report on your Instagram campaigns. Include followers, likes, etc., with this free report template.
Free Instagram white-label report generator
With two simple steps generate automatically a full report of your Instagram profile in Google Looker Studio.

Free Instagram Insights report template
Are you looking for a Free Instagram Insights report template? Check out this Free Instagram Insights report template.
LinkedIn Free Looker Studio Templates
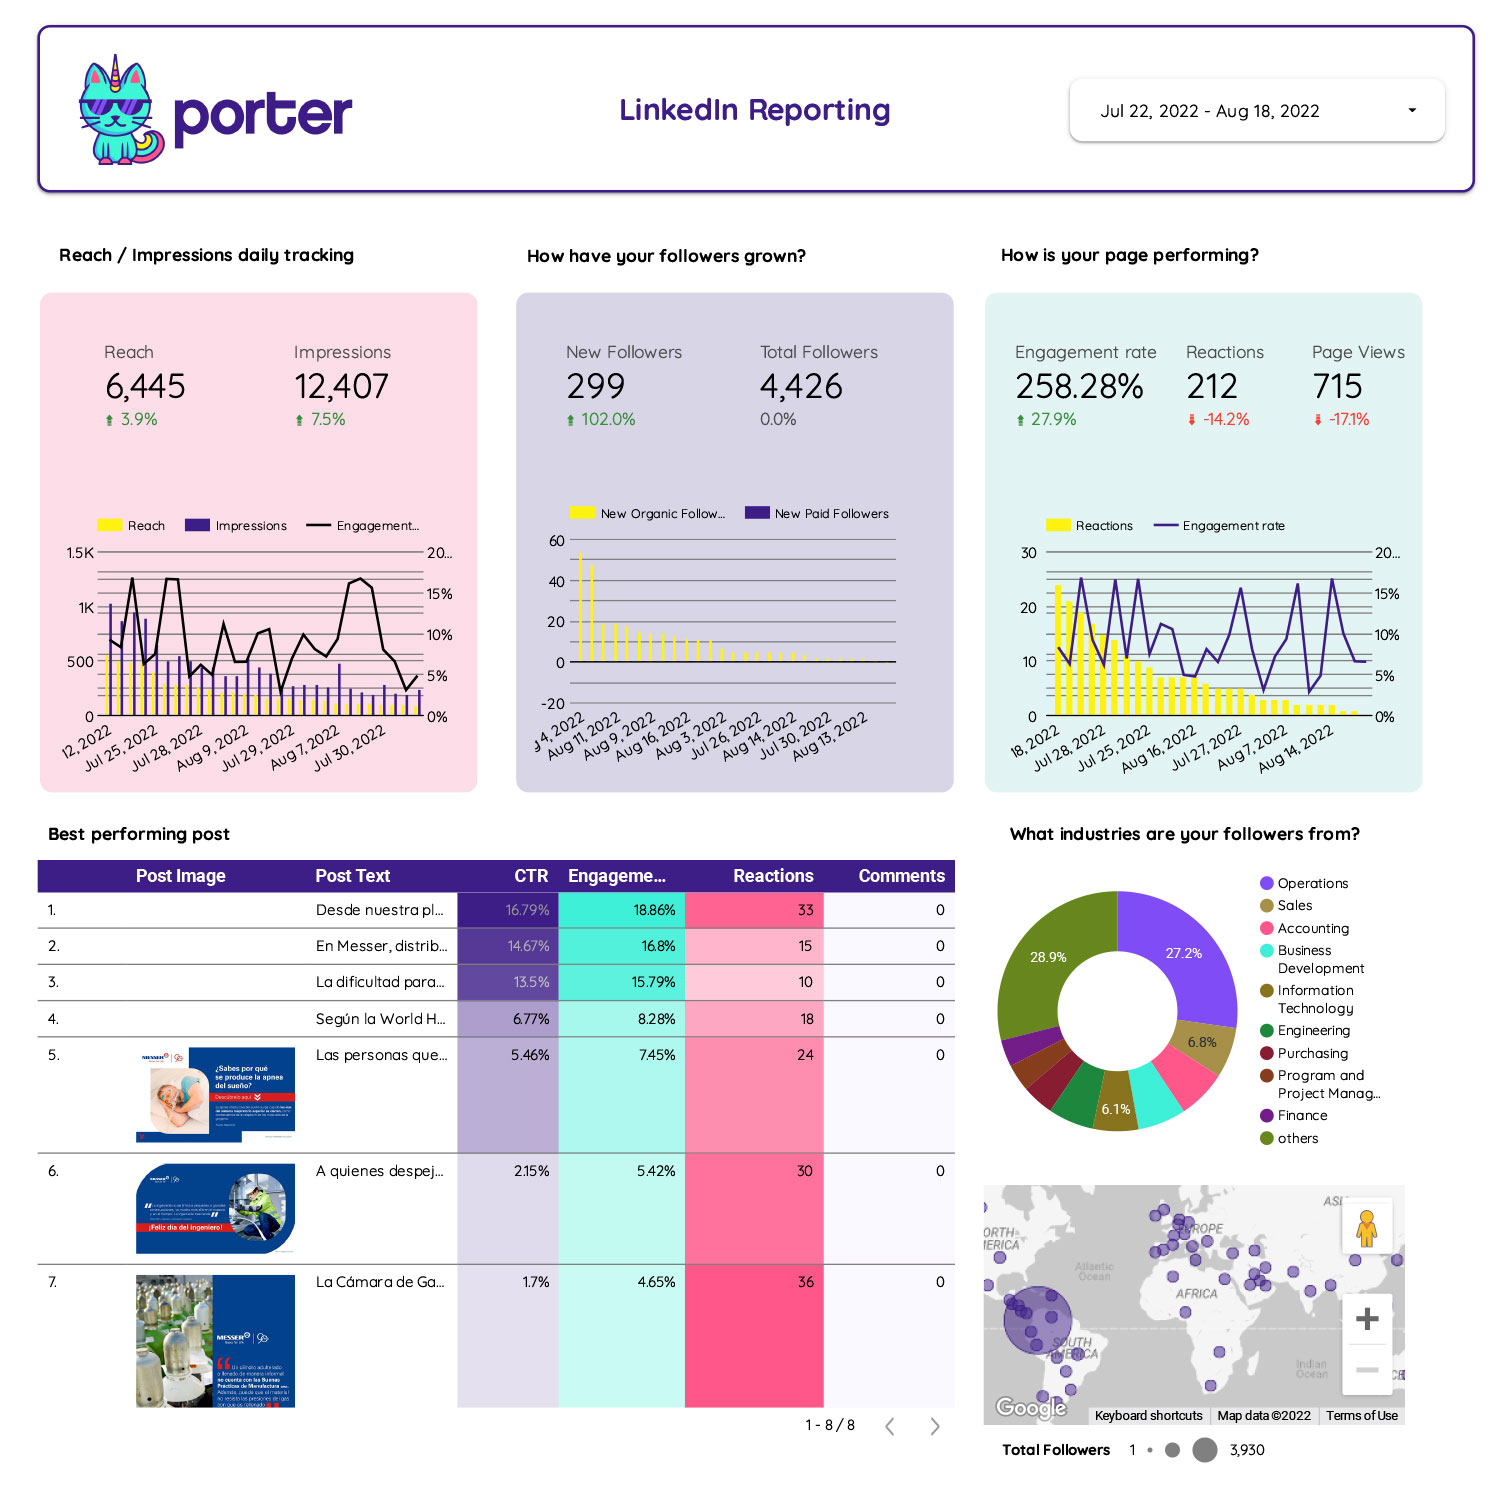
Free Linkedin report templates
The LinkedIn reporting includes both organic data from LinkedIn Pages and Paid data from LinkedIn Ads.
LinkedIn Pages and LinkedIn Ads Report template
Looking for a LinkedIn Pages Report template? Check out this LinkedIn Pages and LinkedIn Ads Report template.
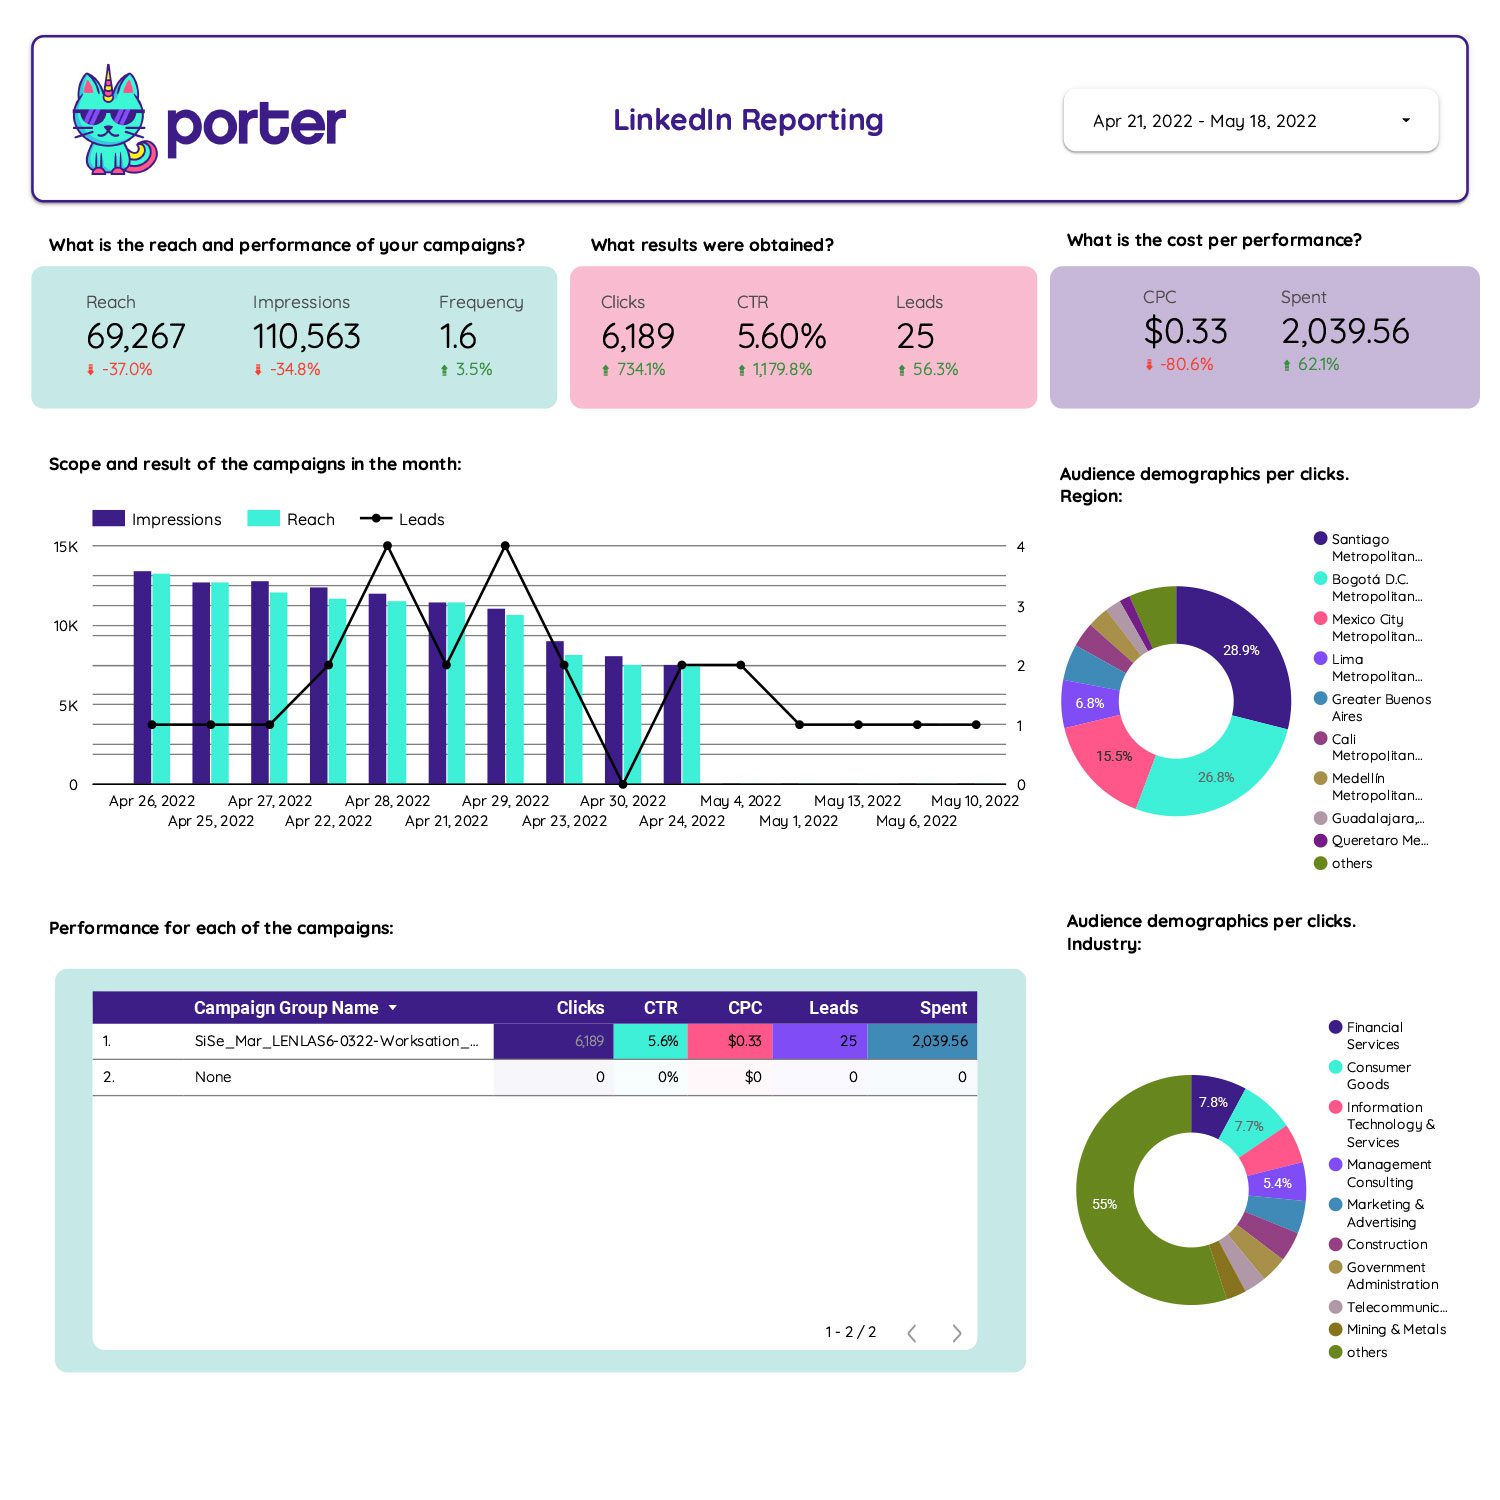
Looker Studio LinkedIn Paid and Organic report template
Looking for a LinkedIn Paid and Organic Report for Looker Studio? Check out this Looker Studio template. FREE Download!
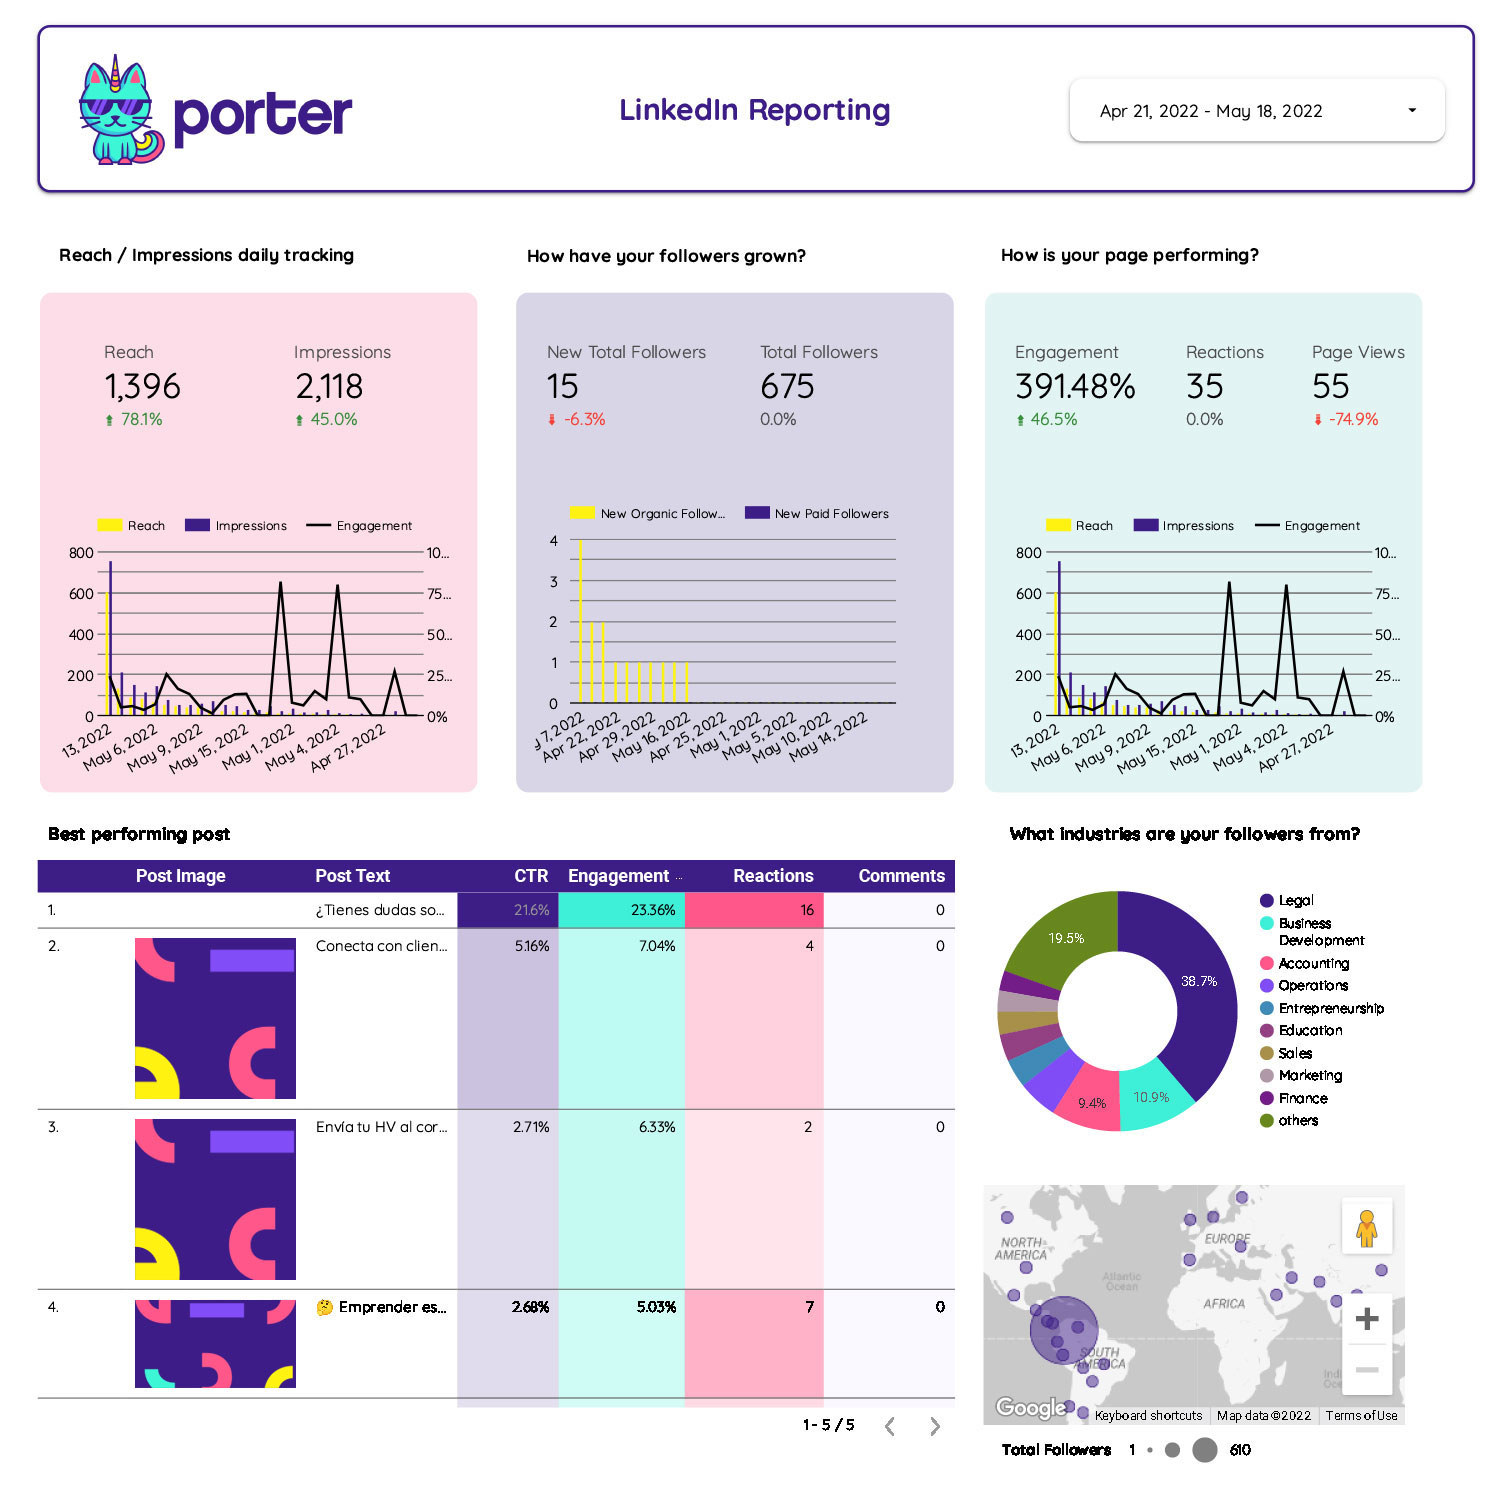
Full LinkedIn report template for Google Looker Studio
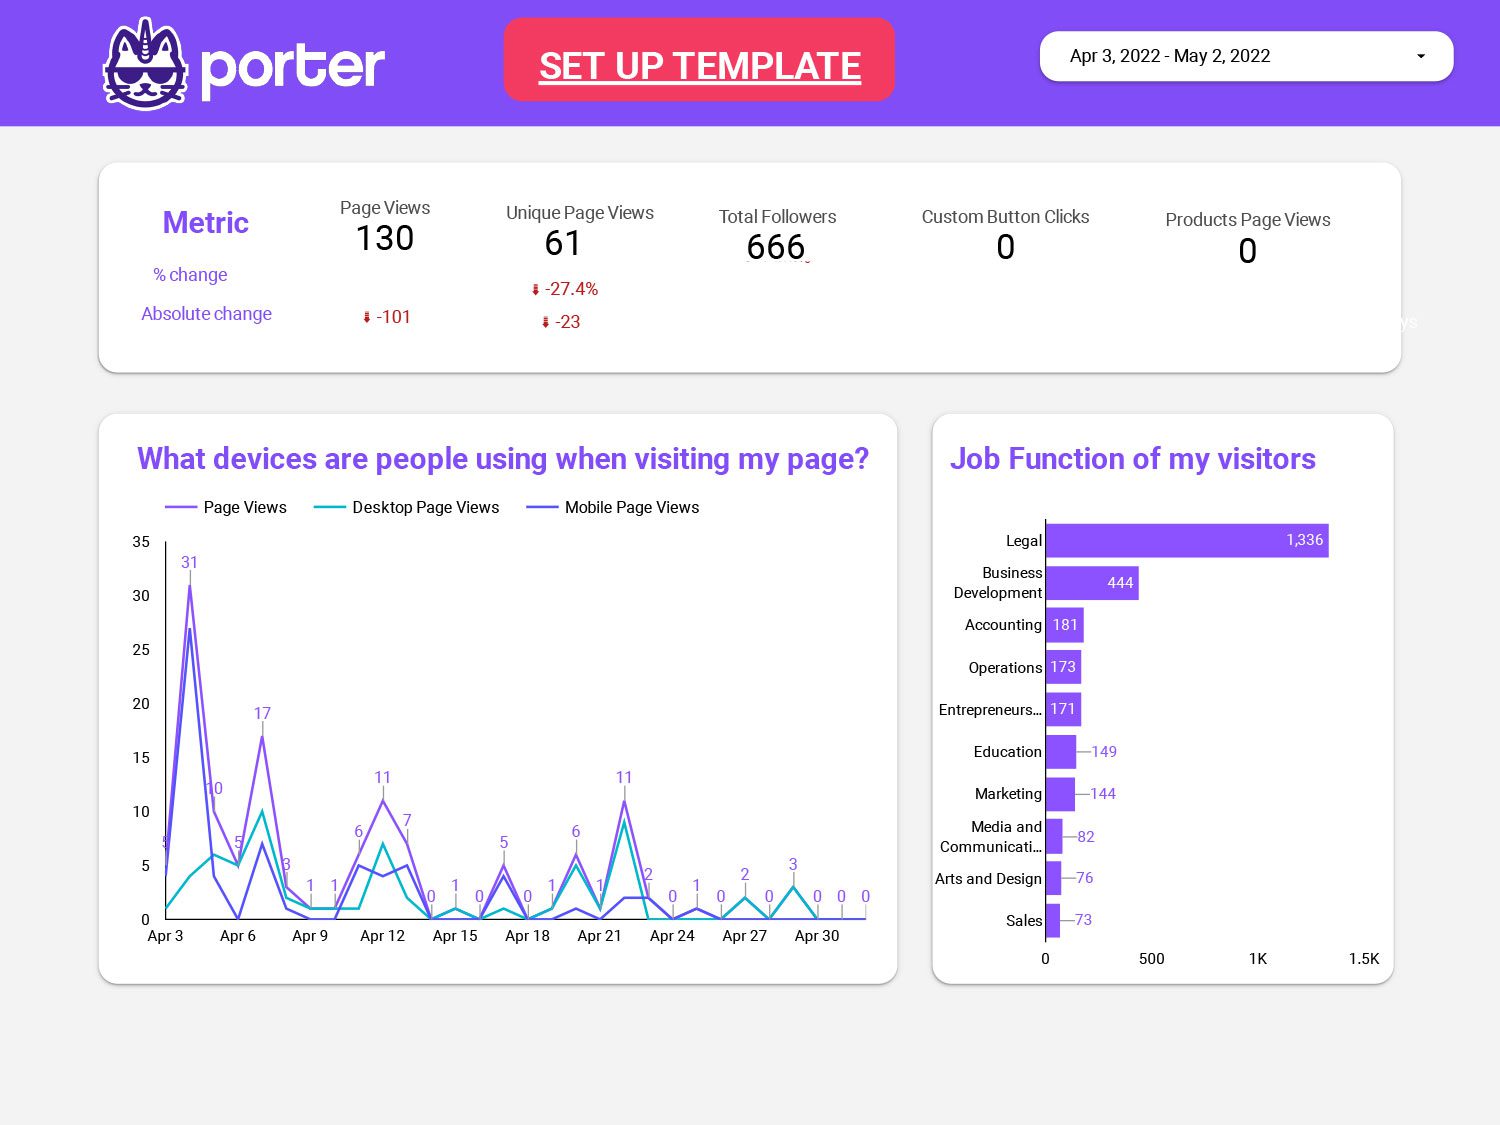
Understand your LinkedIn Company Pages’ performance at a glance with this free Google Looker Studio template. Organic + LinkedIn Ads
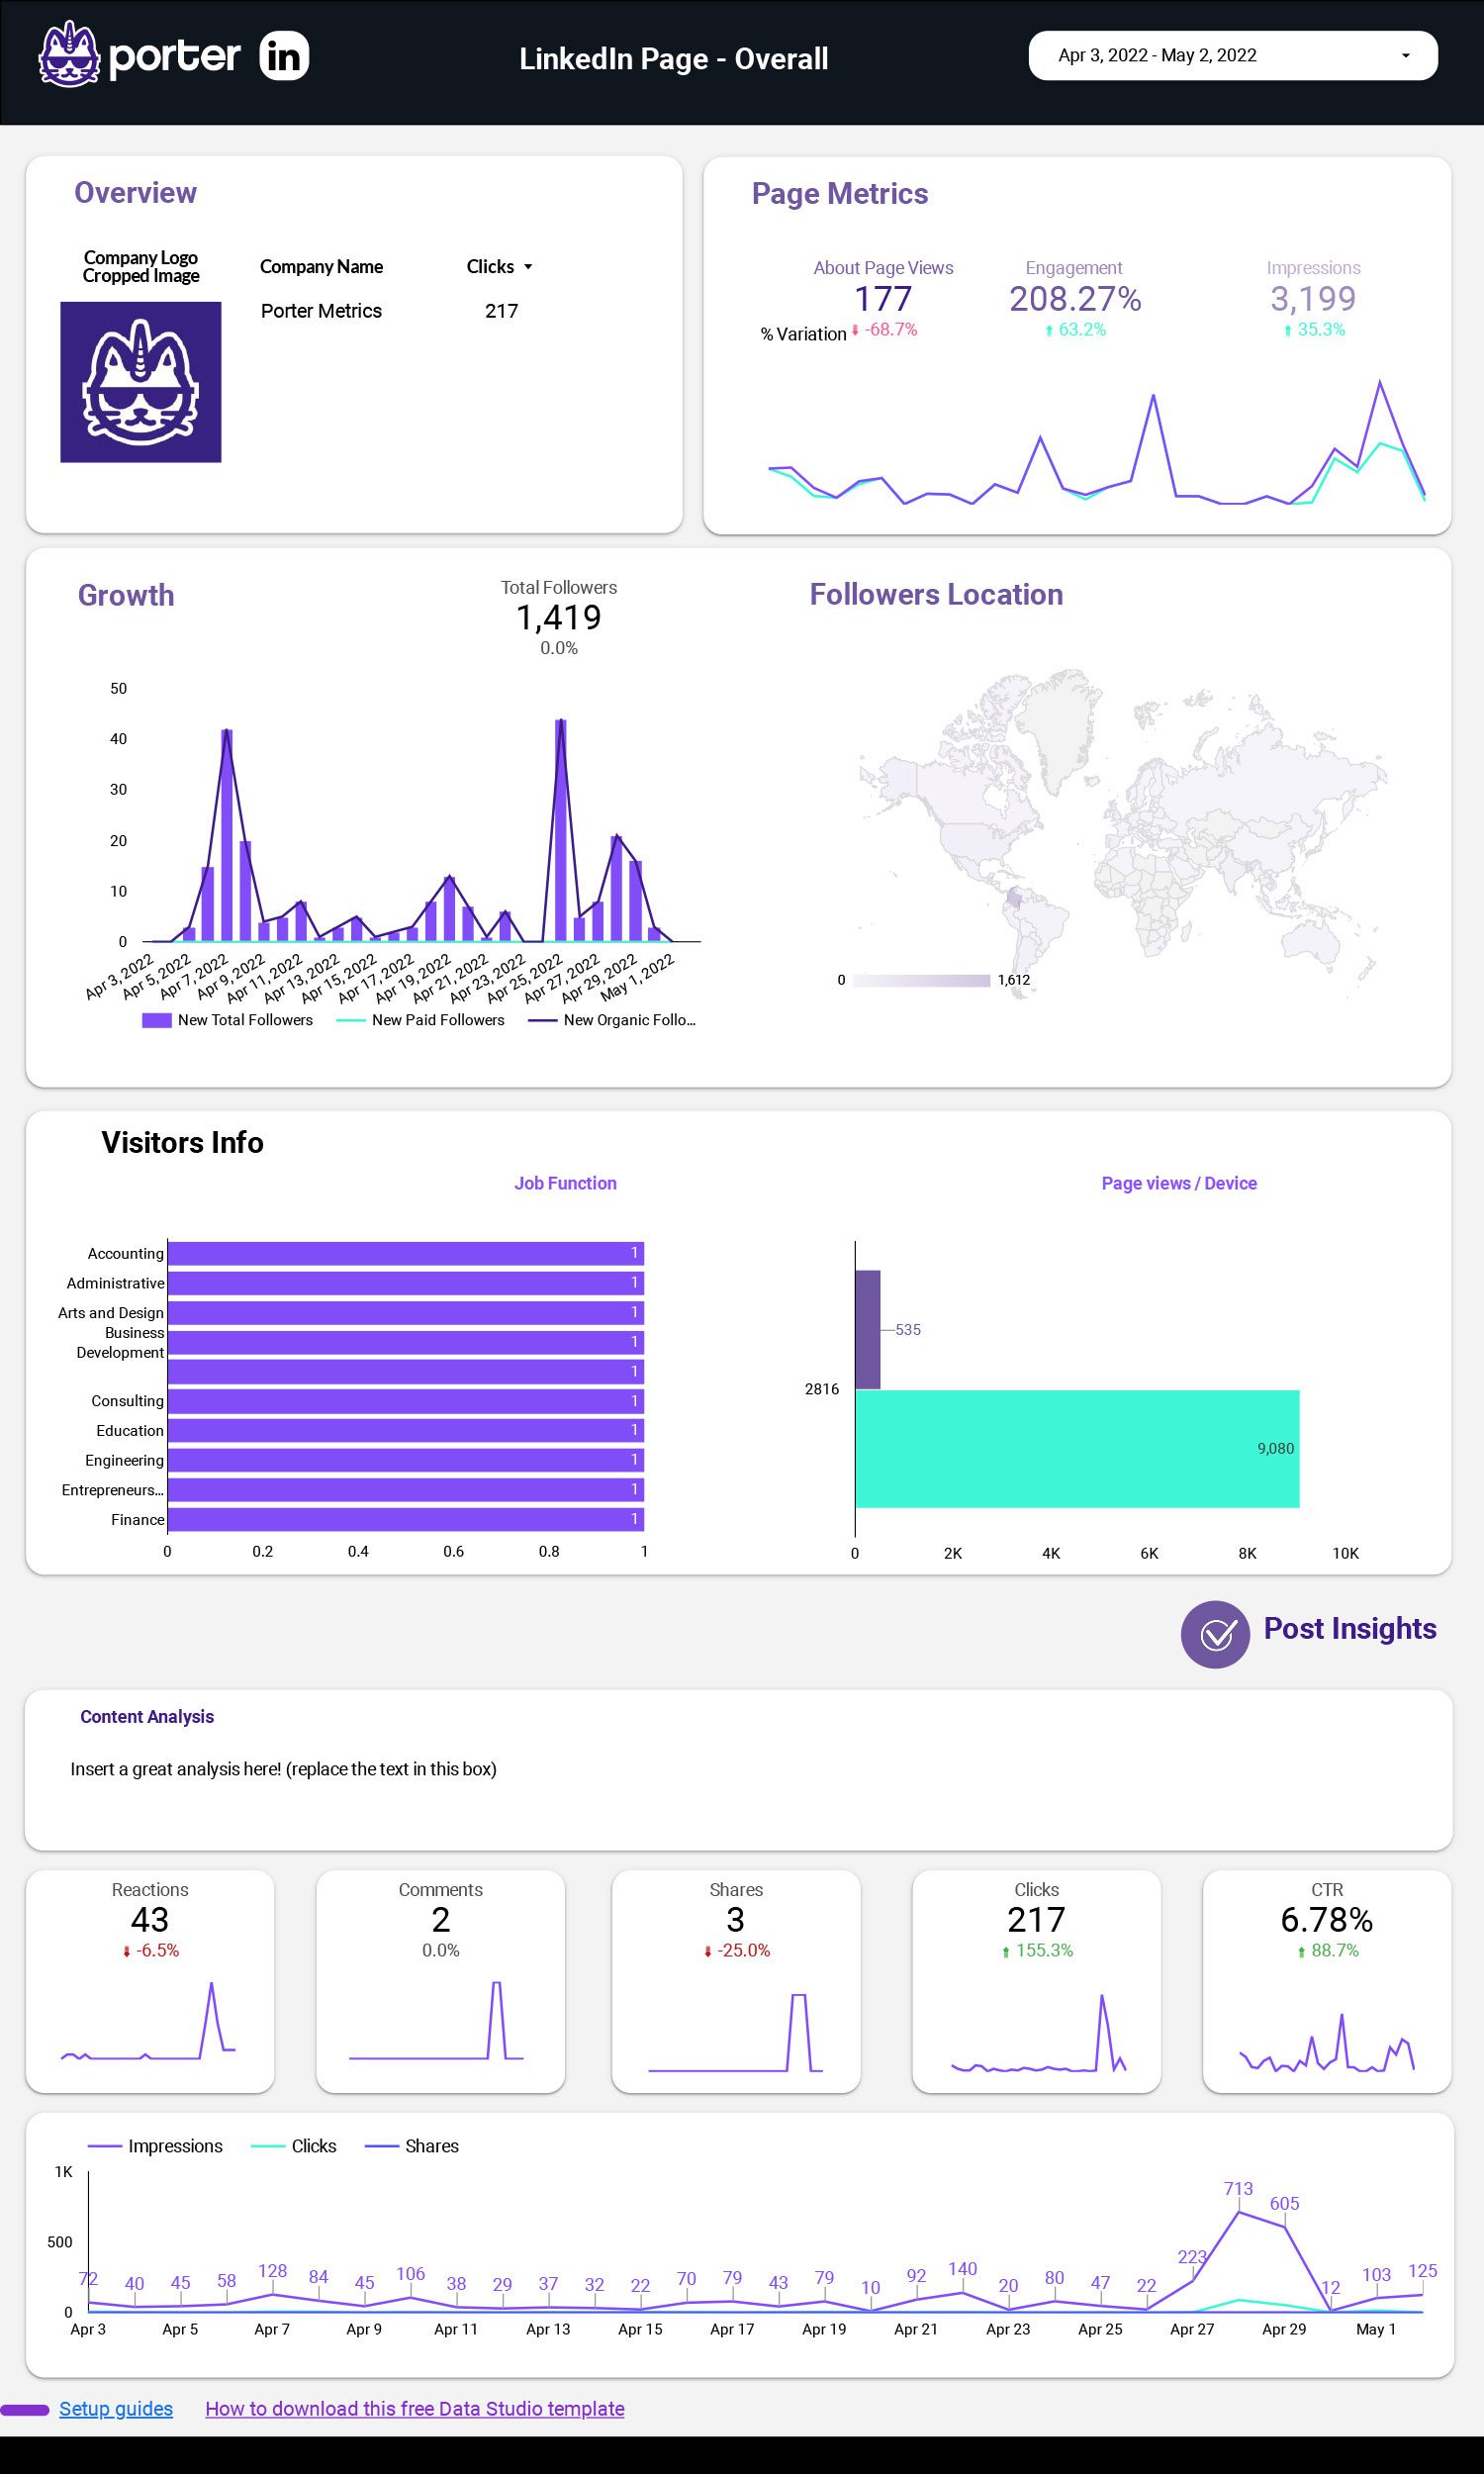
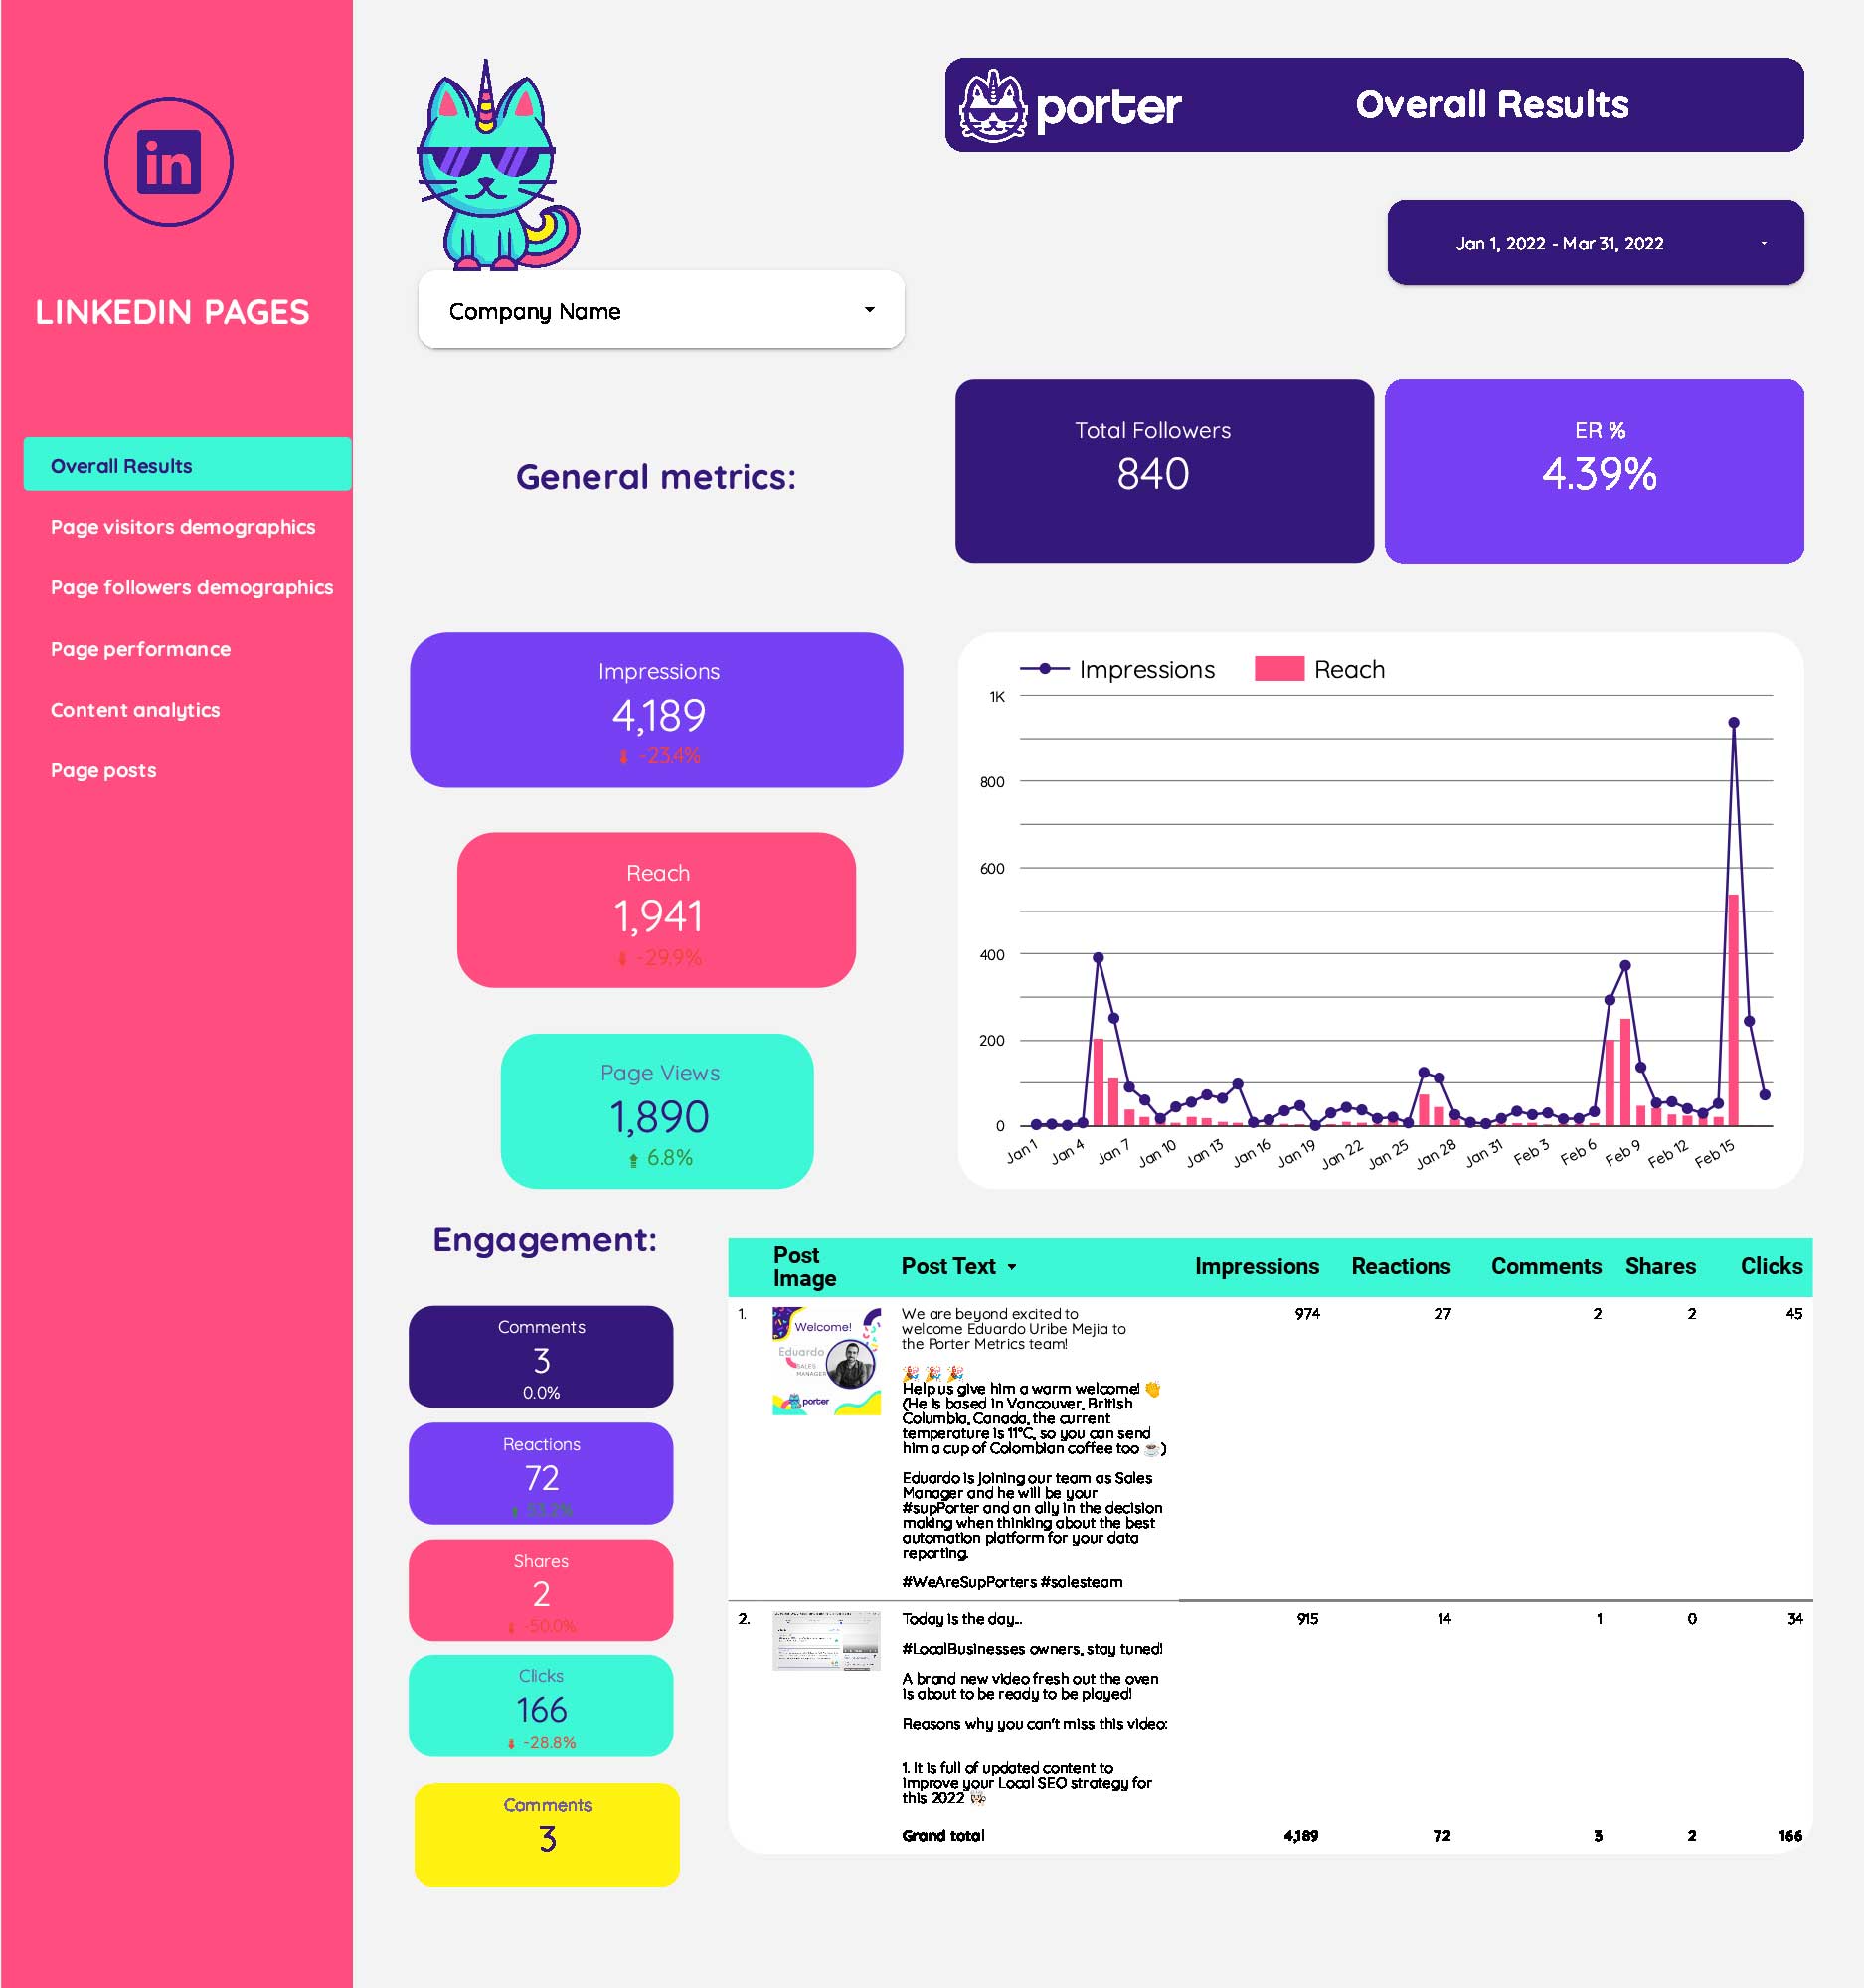
LinkedIn Pages report template on Google Looker Studio
Understand your LinkedIn Company Pages’ performance at a glance with this free Google Looker Studio template.
TikTok Free Looker Studio Templates
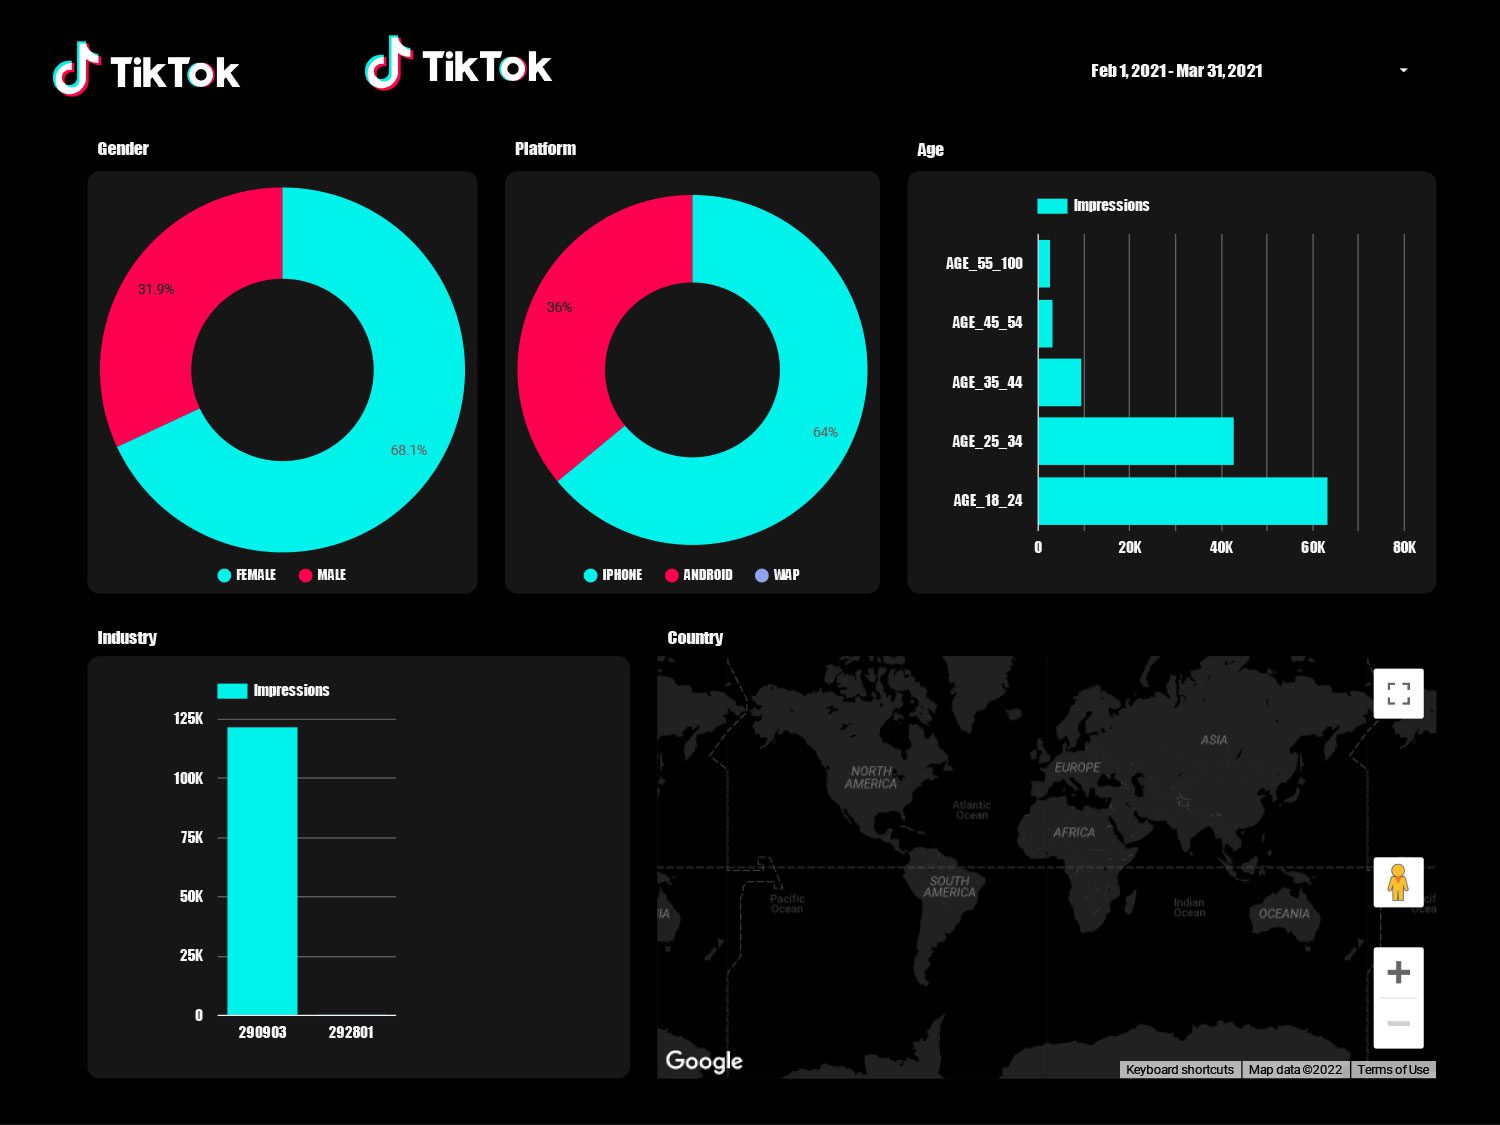
TikTok Ads free report template for Google Looker Studio
Download this TikTok Ads report template for Google Looker Studio. Start tracking your efforts to understand the impact of your paid content.
Twitter Looker Studio Templates
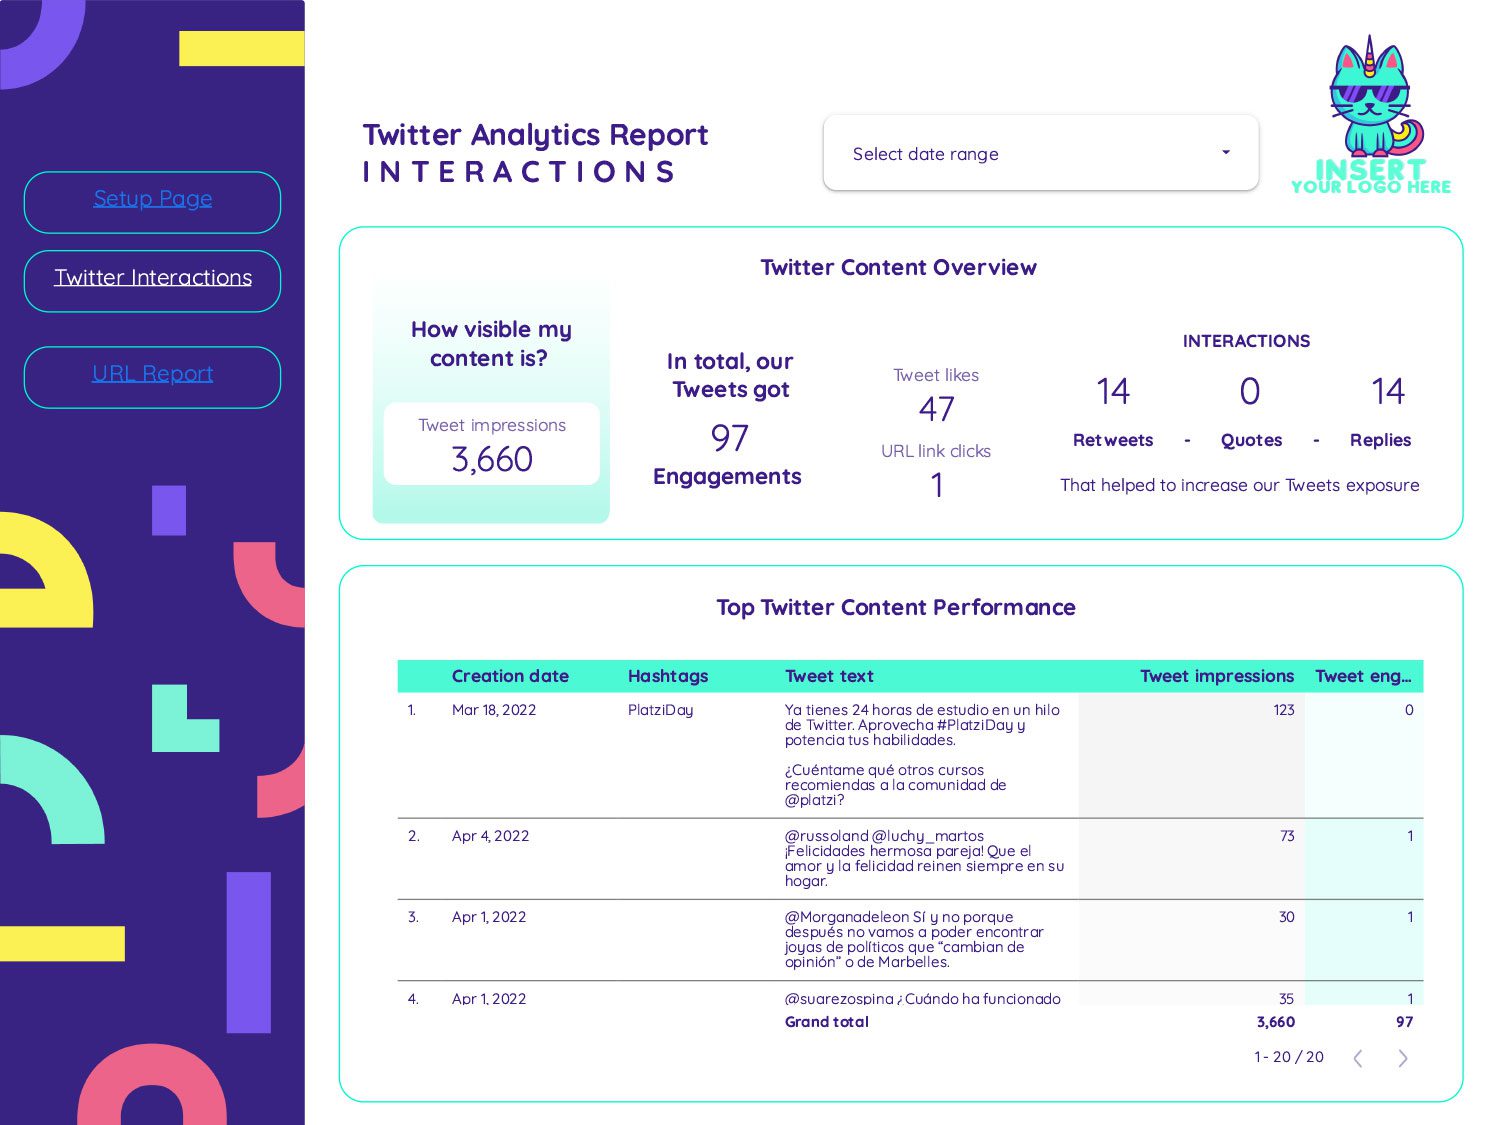
Twitter Analytics engagement report template
With this Twitter Analytics report template. Integrate into one visualization the main KPIs to deliver the best insights. It’s FREE
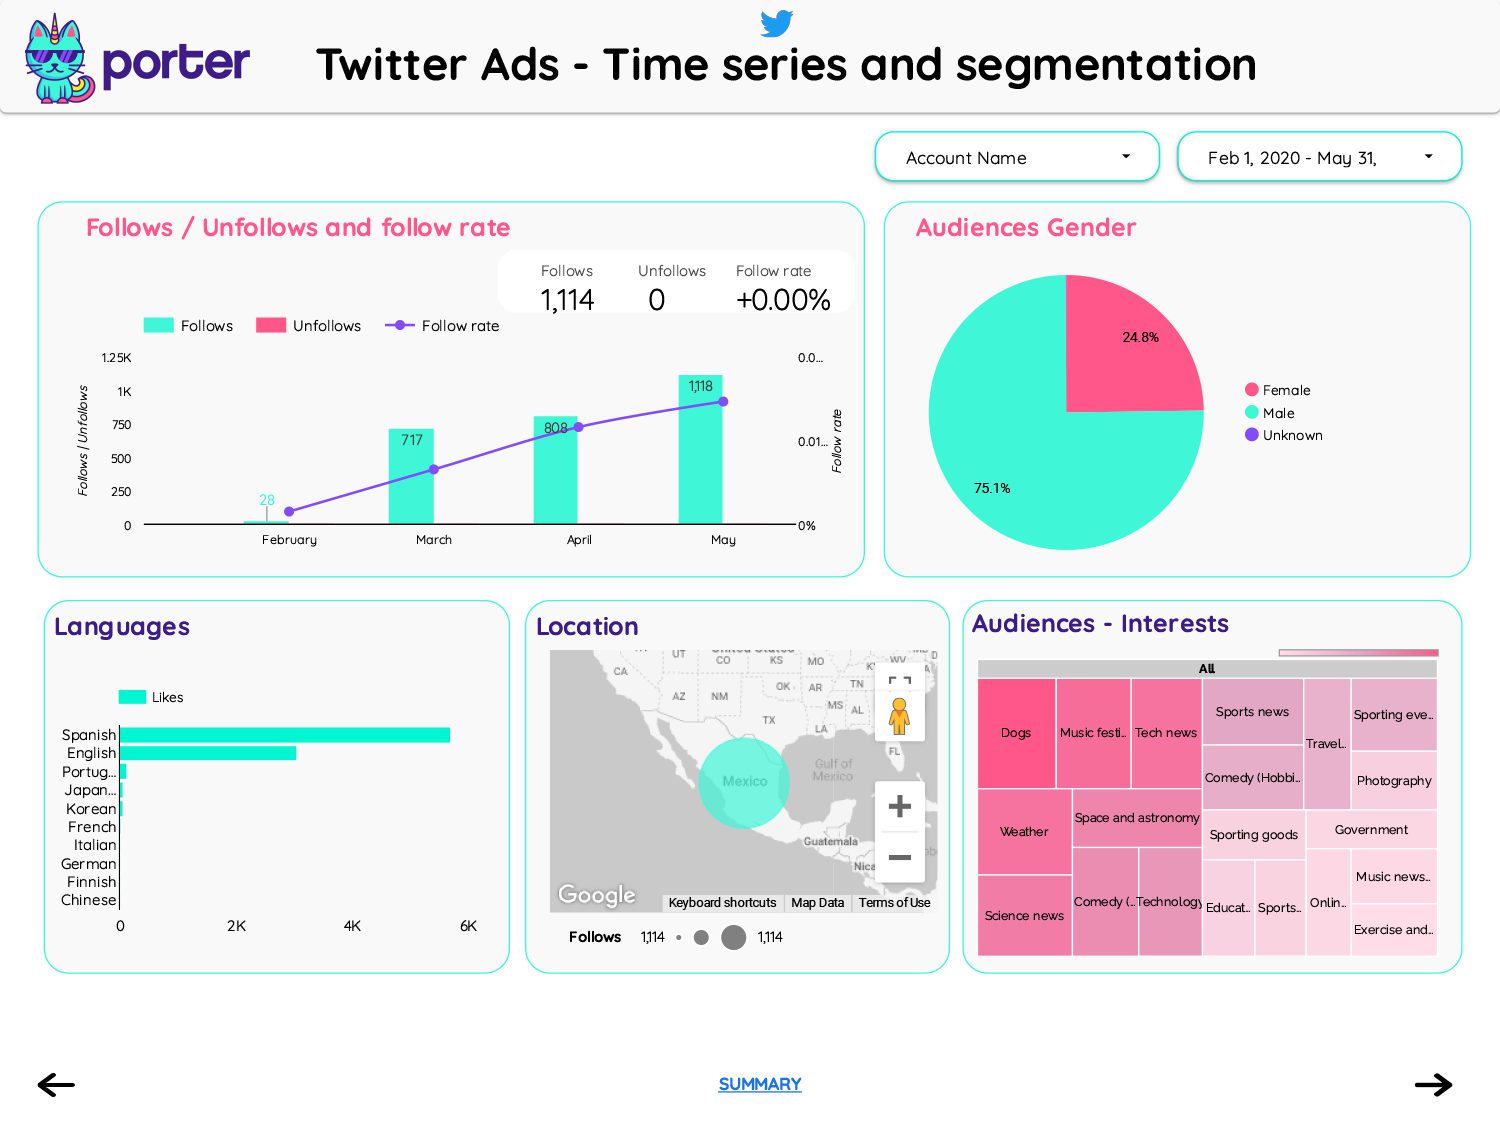
Free Twitter Ads full report template
Looking for a Free Twitter Ads full report template? Check out our free report template for marketers and data analysts.
Youtube Report Looker Studio Templates
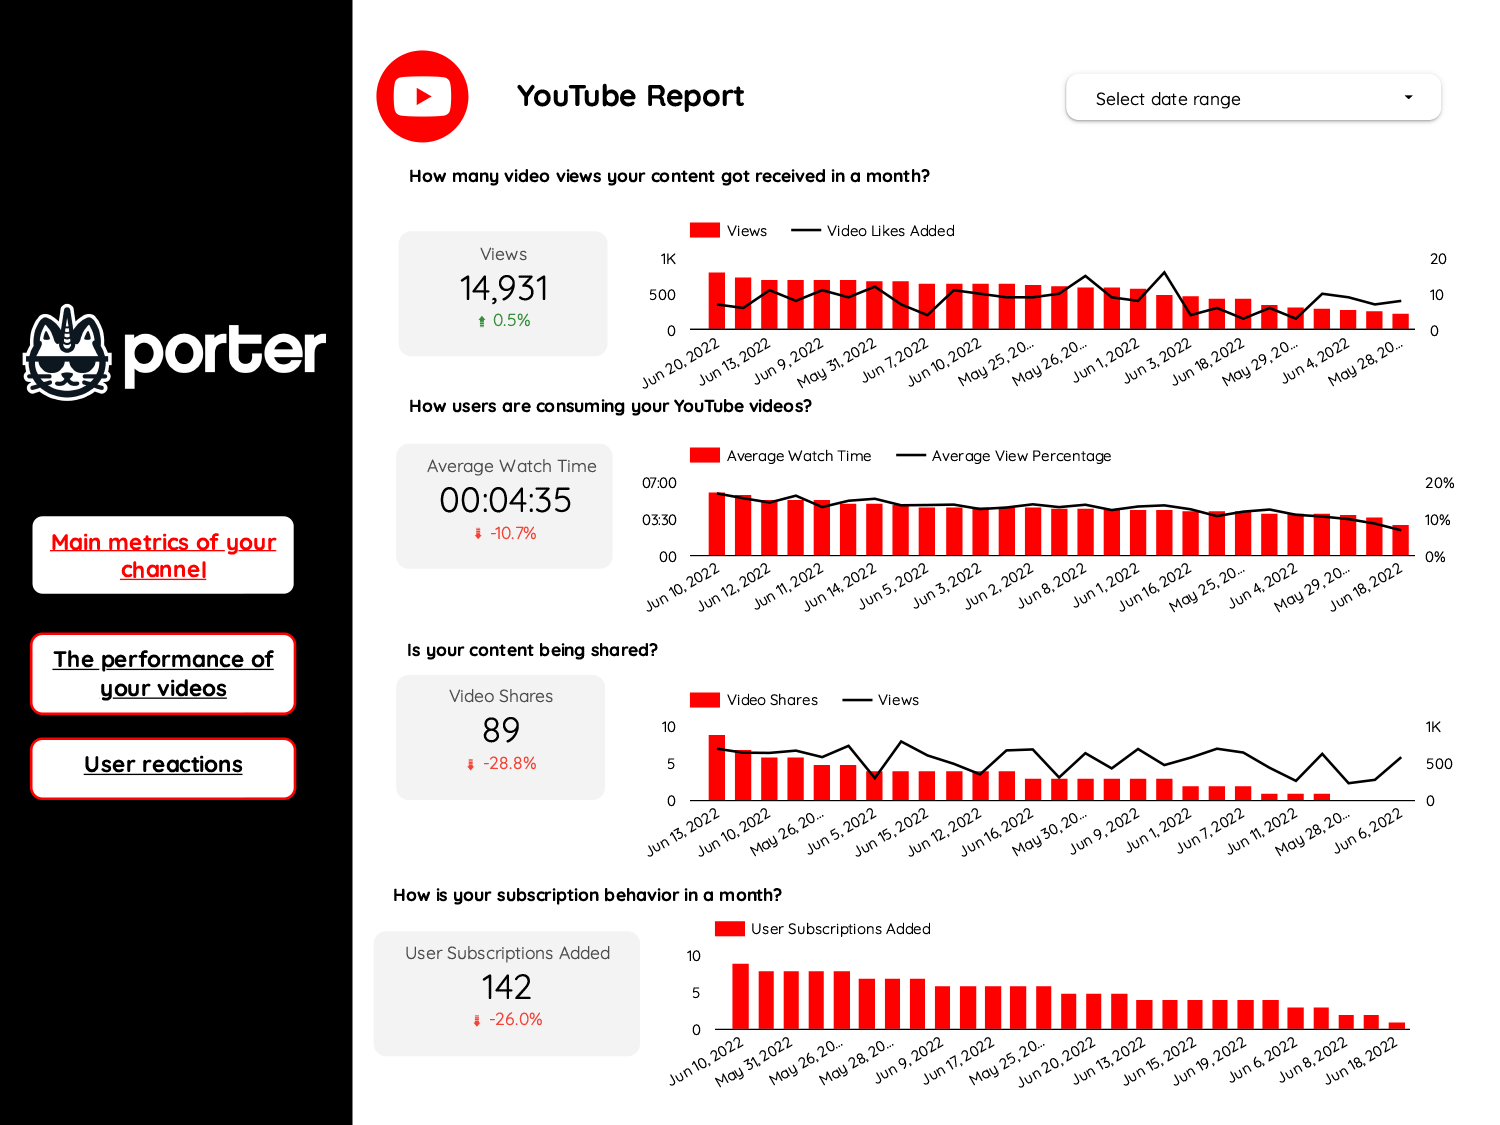
YouTube Video Performance Report Template
Download a free YouTube performance Report Template that displays insightful metrics all in one place using Google Looker Studio.
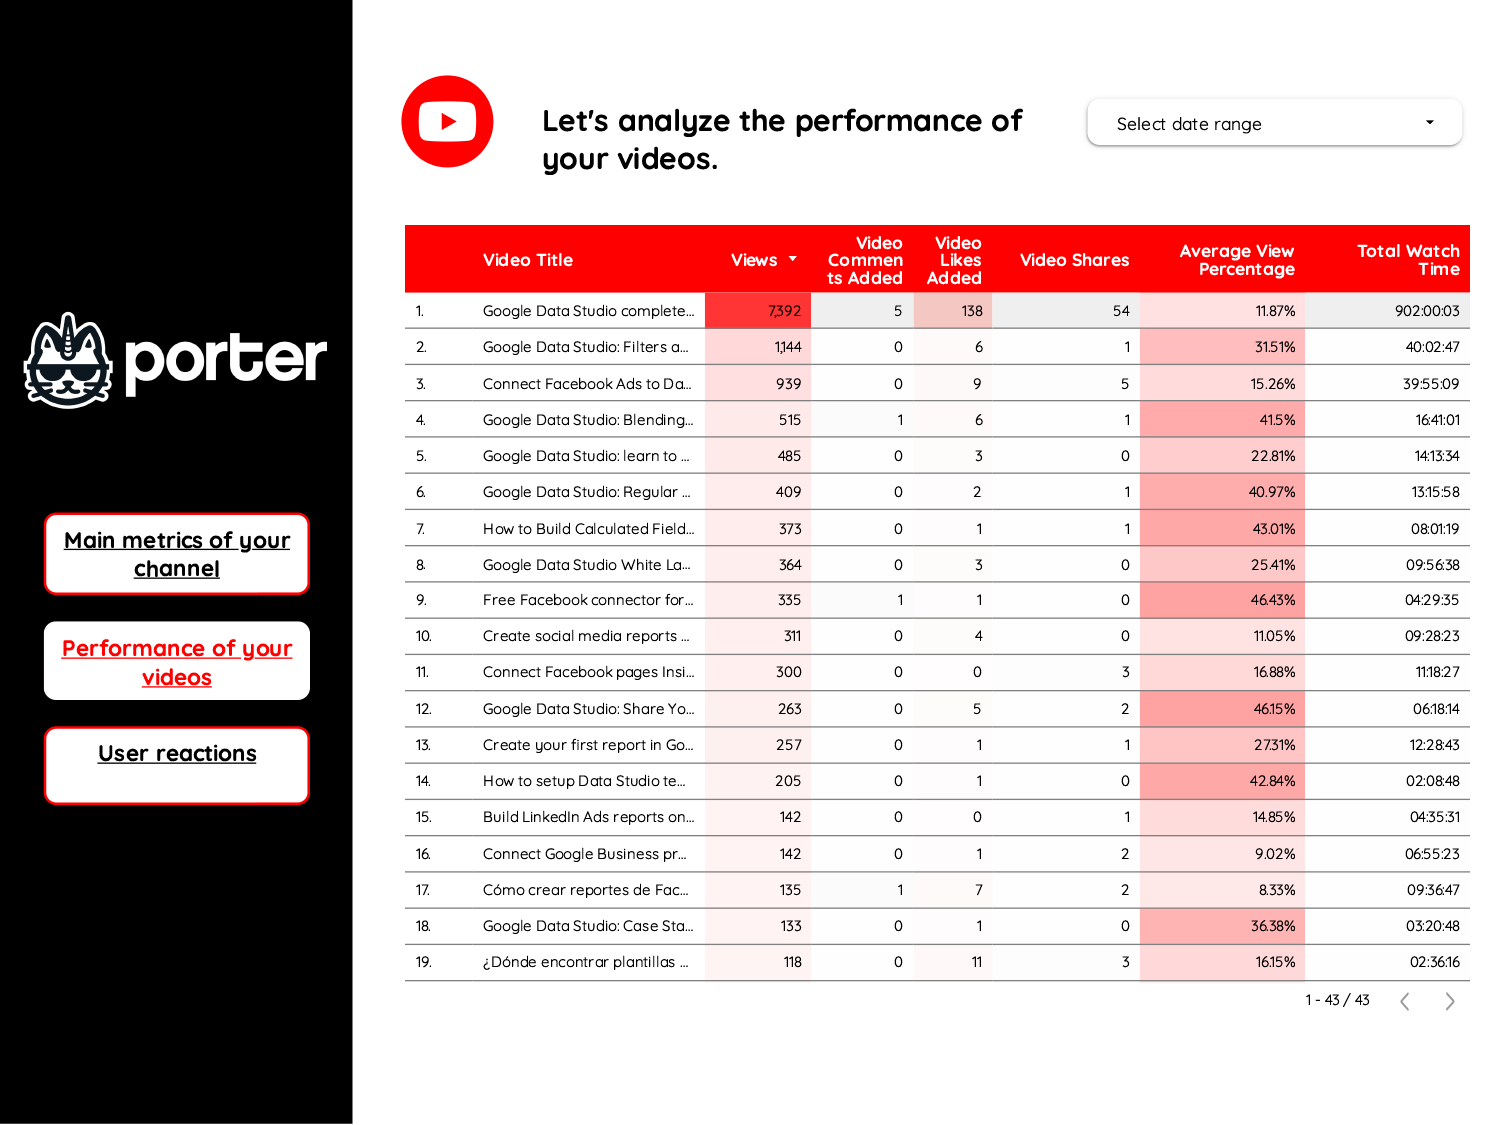
YouTube Channels videos performance report – Template for Google Looker Studio
This single-page YouTube Channels videos performance report template for Google Looker Studio shows you the views, engagements, and performance on your channel.
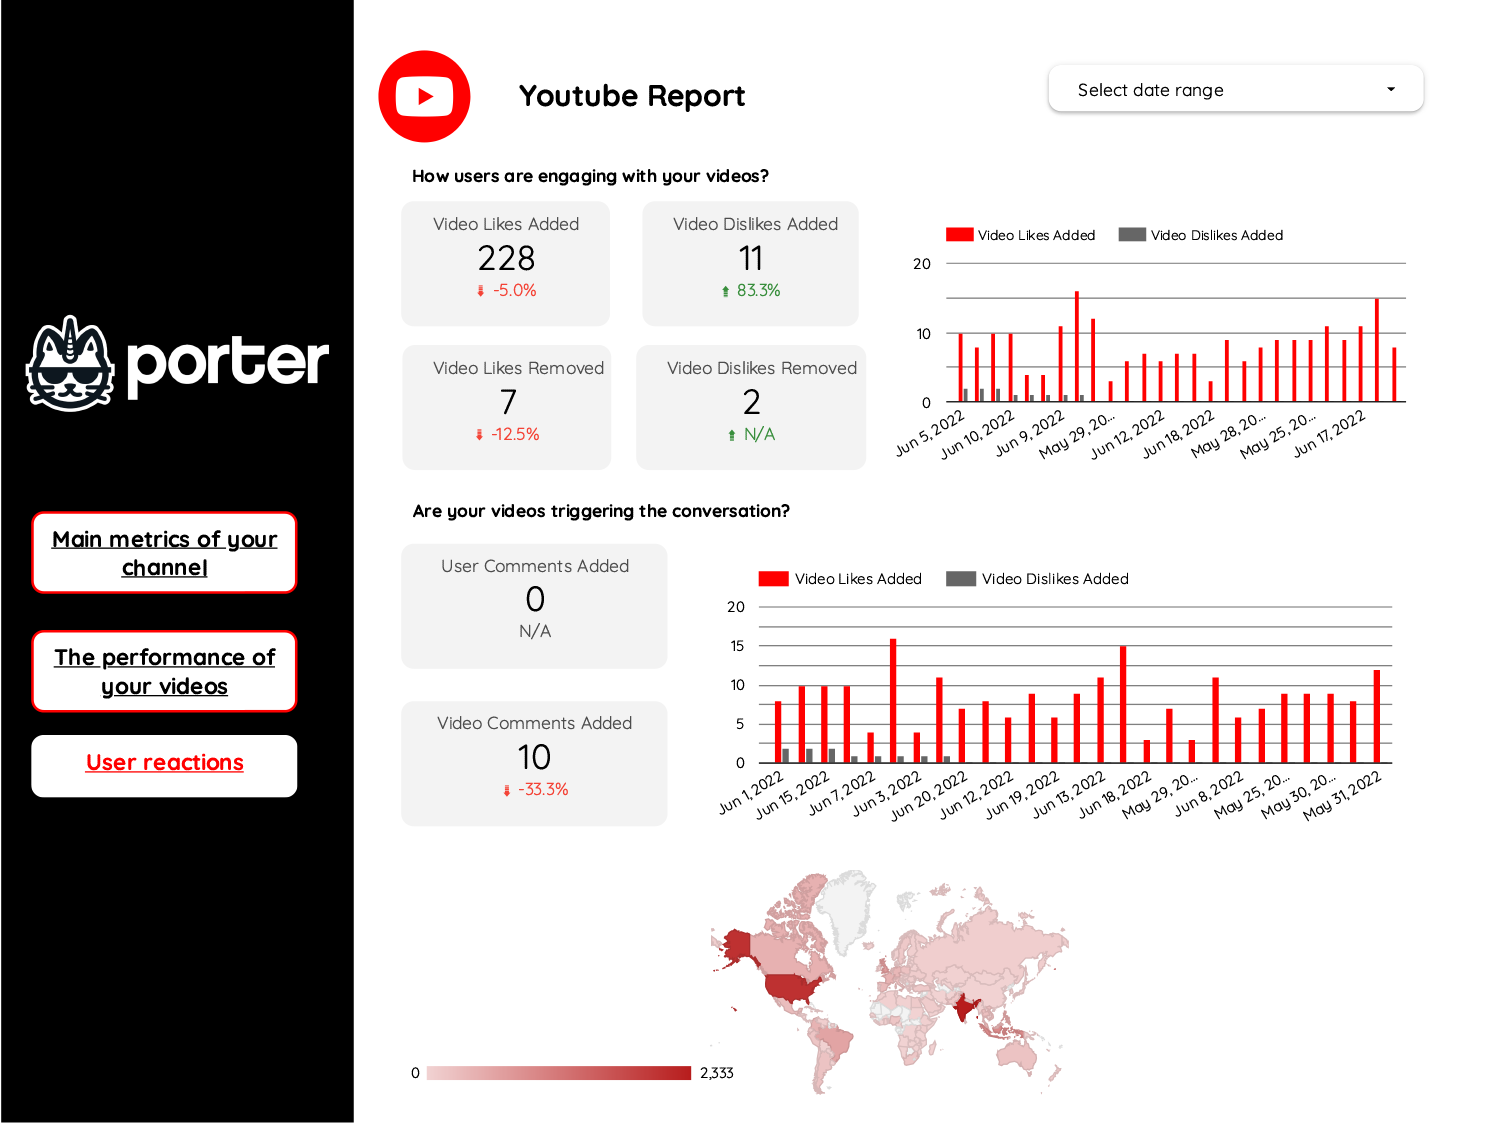
YouTube Report – Free Template for Google Looker Studio
Download this Free YouTube Template and track the principal metrics in only one dashboard in Google Looker Studio
Shopify Free Looker Studio Templates
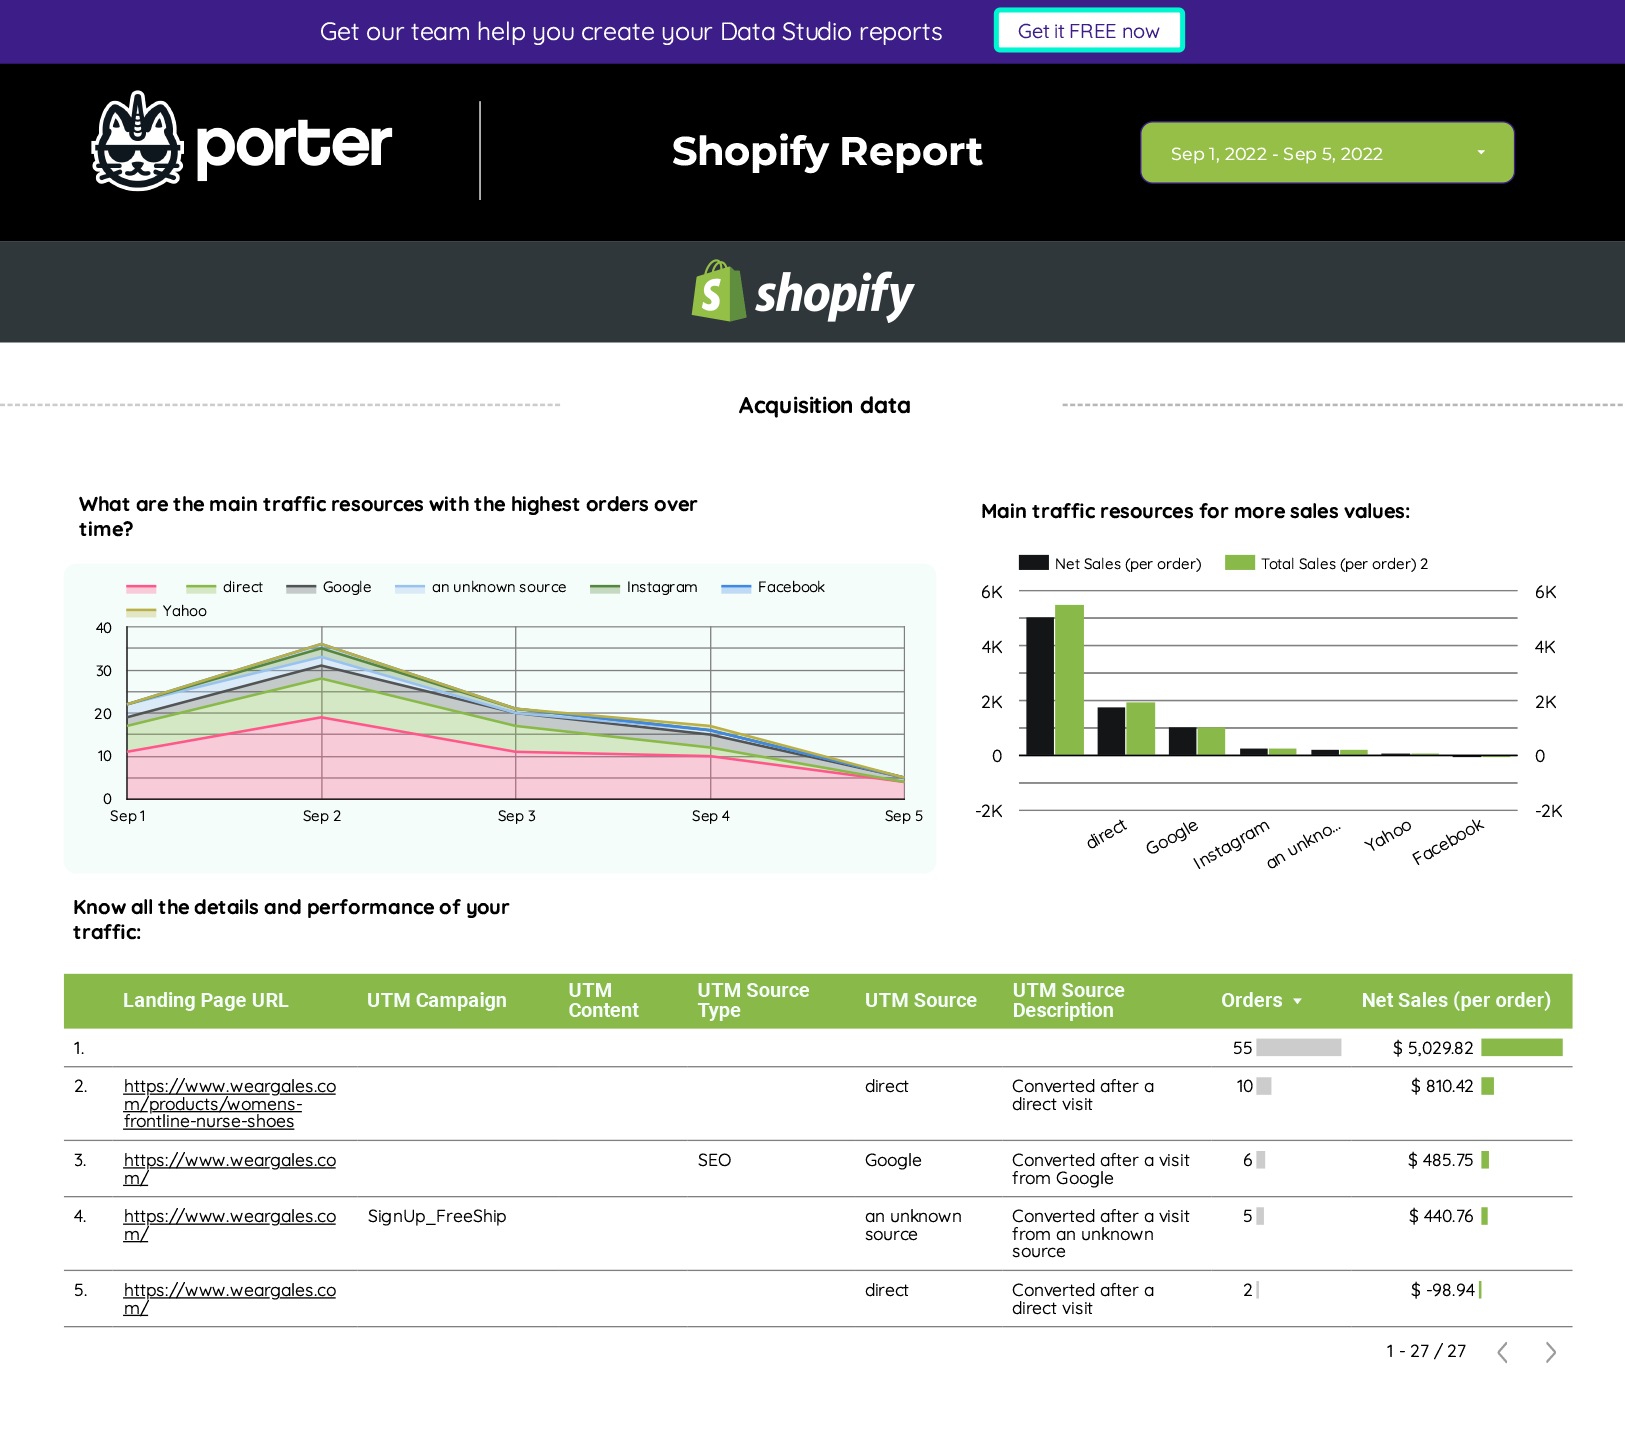
Free Shopify sales report template for Looker Studio
This is the initial report (the first template) of the Shopify connector, it allows for tracking the sales produced.
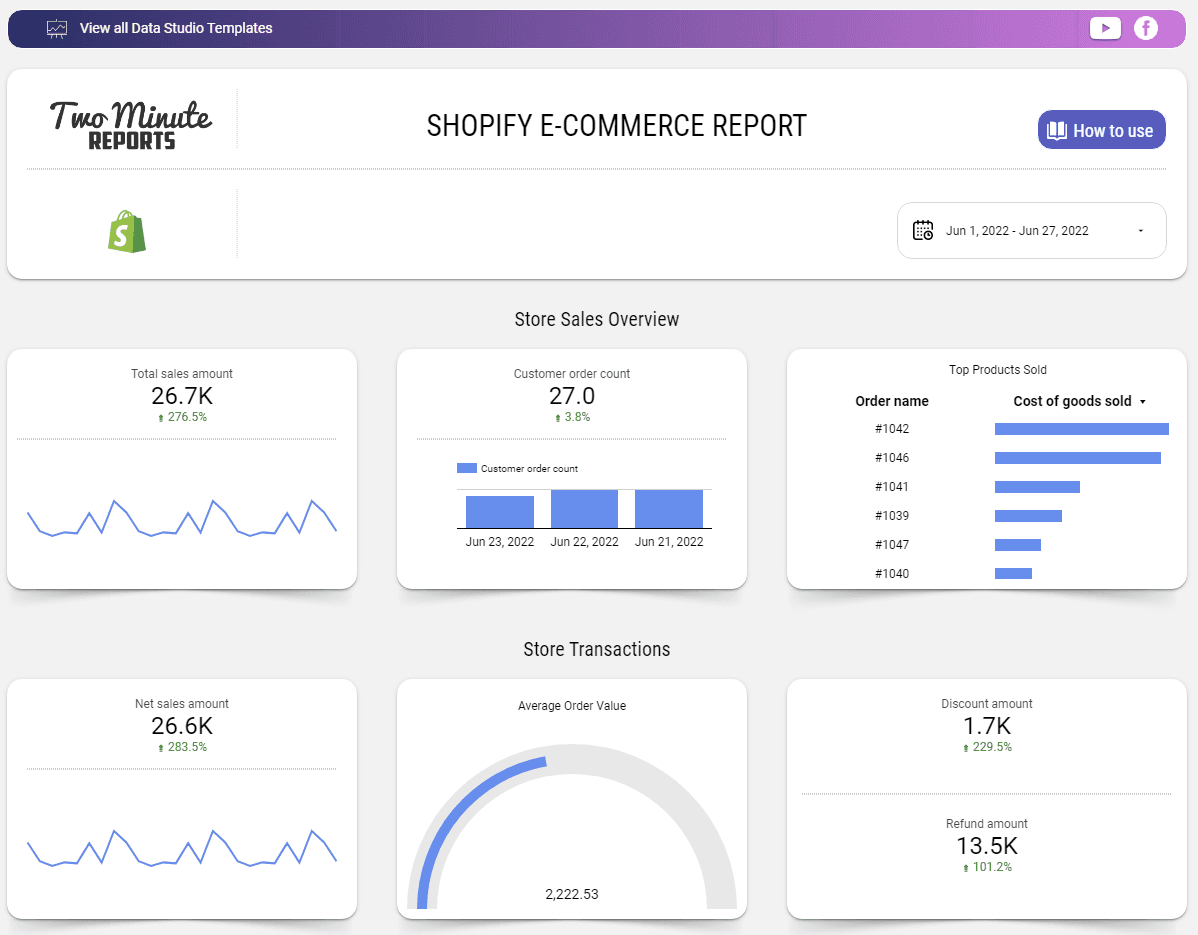
Shopify E-Commerce Report
This is a sophisticated single-page Shopify e-commerce template that allows you to view Store Sales Overview, Store Sales Transactions, and Product Performance all from a single page. To see an exact representation of the template, click on preview.
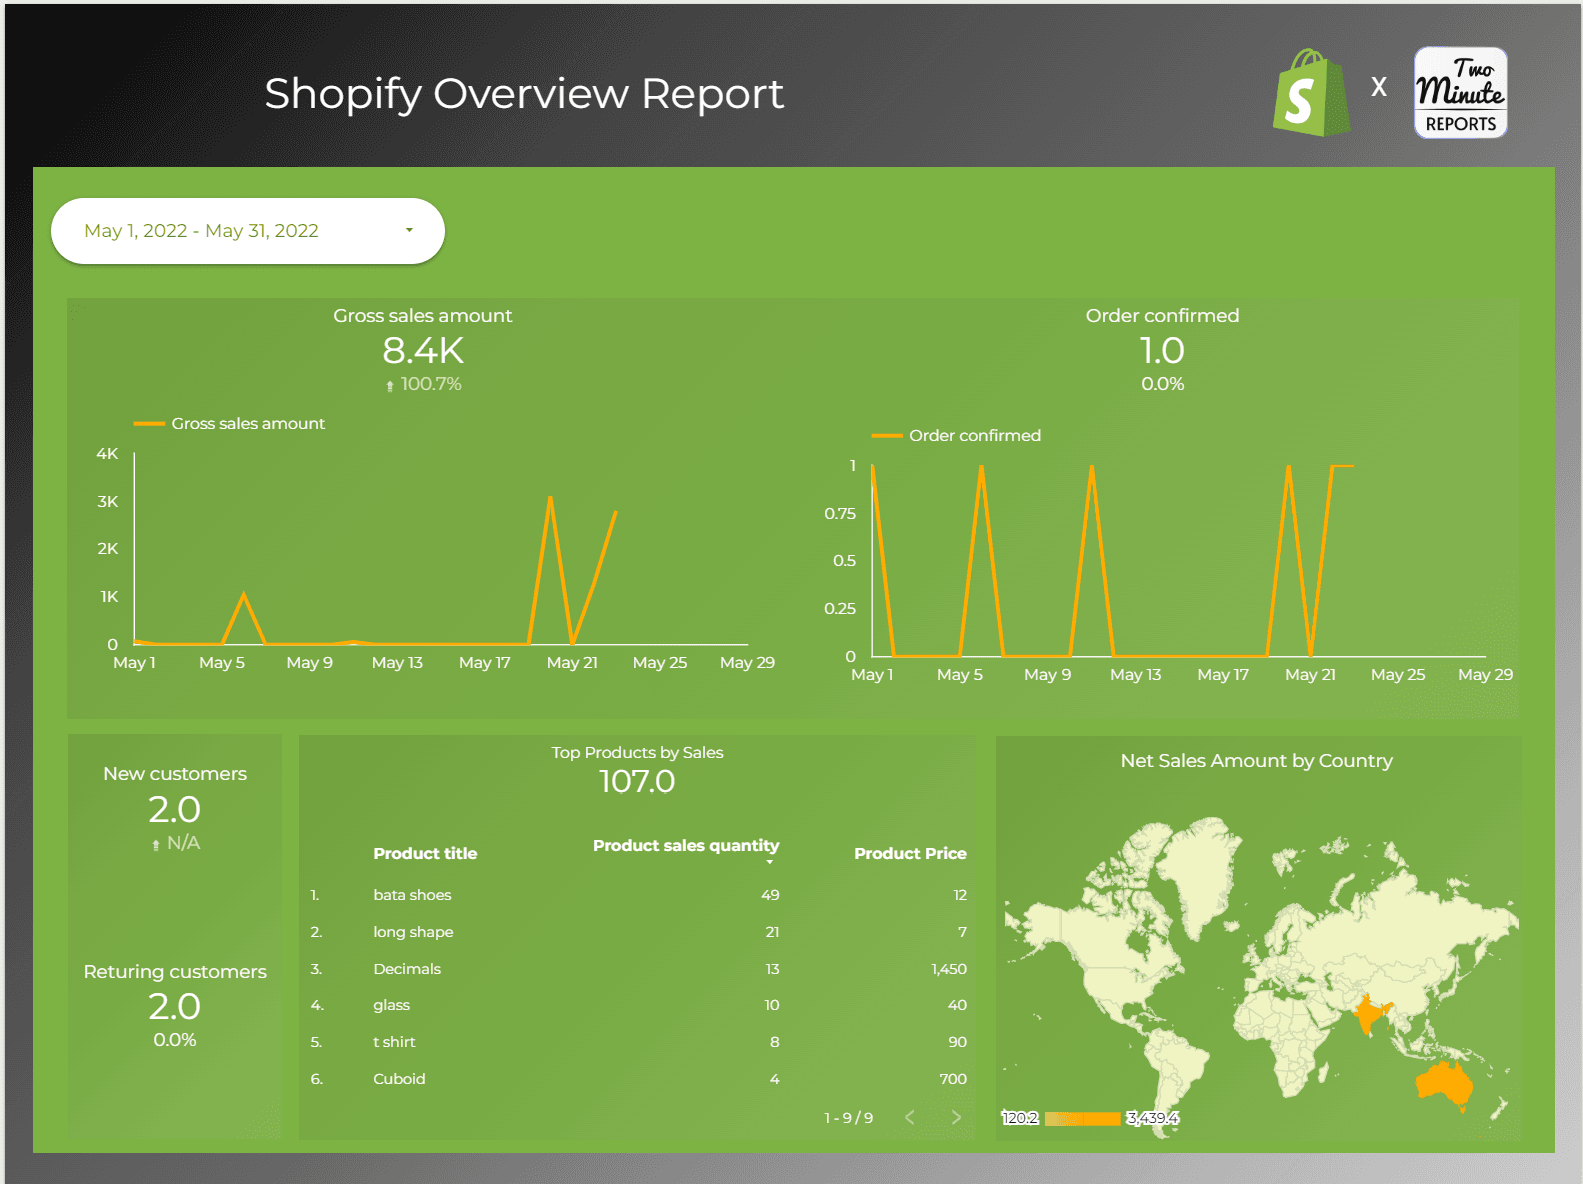
Shopify Overview Report
This Shopify template is unique and interactive. It offers descriptive scorecards with comparison data and graphs for gross sales amount, confirmed orders, new customers, and returning customers during the respective date ranges. The template also includes tables to view top products by sales and an overview of sales. Additionally, there is a country chart that shows net sales amounts in different regions. All of these metrics can be controlled using the date filter at the top.
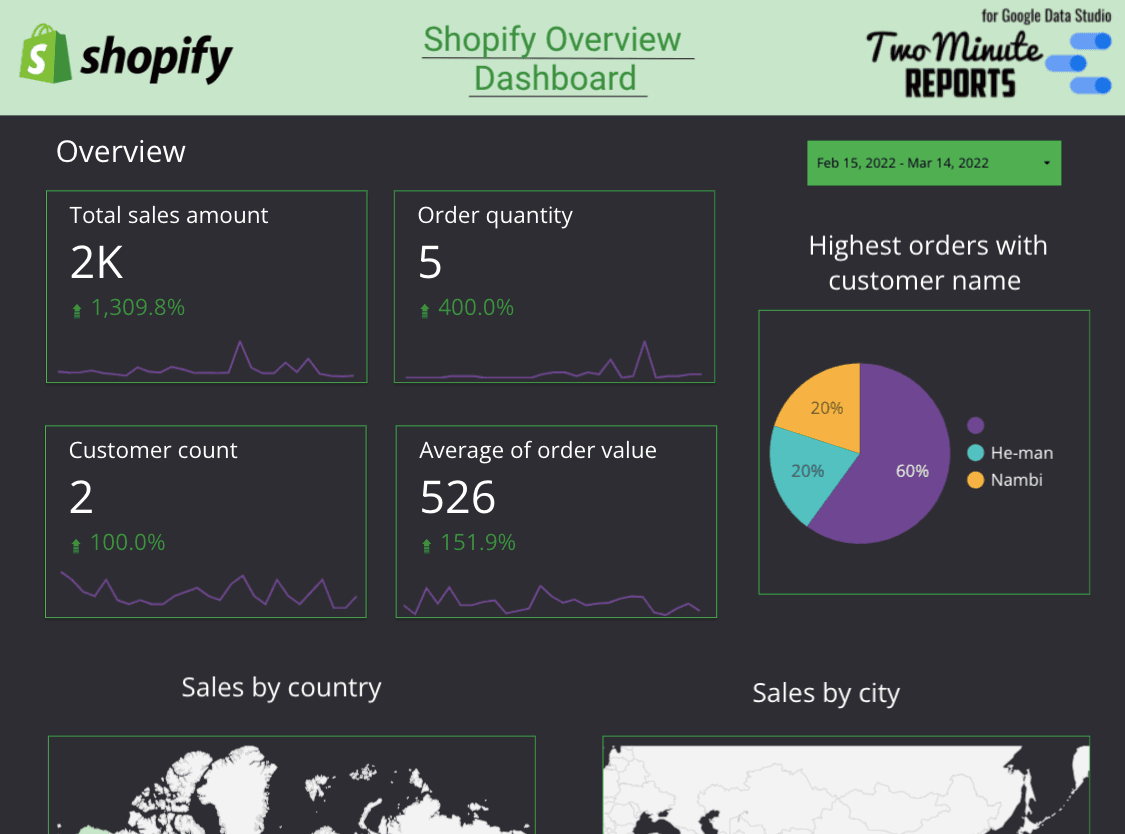
Shopify Overview
This is an intuitive and interactive Shopify dashboard. It displays all major KPIs, such as total sales amount, order quantity, customer count, and average order value as scorecards. You can also view the regions of your customers through sales by country and sales by city geo charts. Interactive heatmap tables are available for sales over time, orders report, orders report with products and sales by product. This template serves as a one-stop shop for your entire Shopify account.
Google My Business Free Report Templates
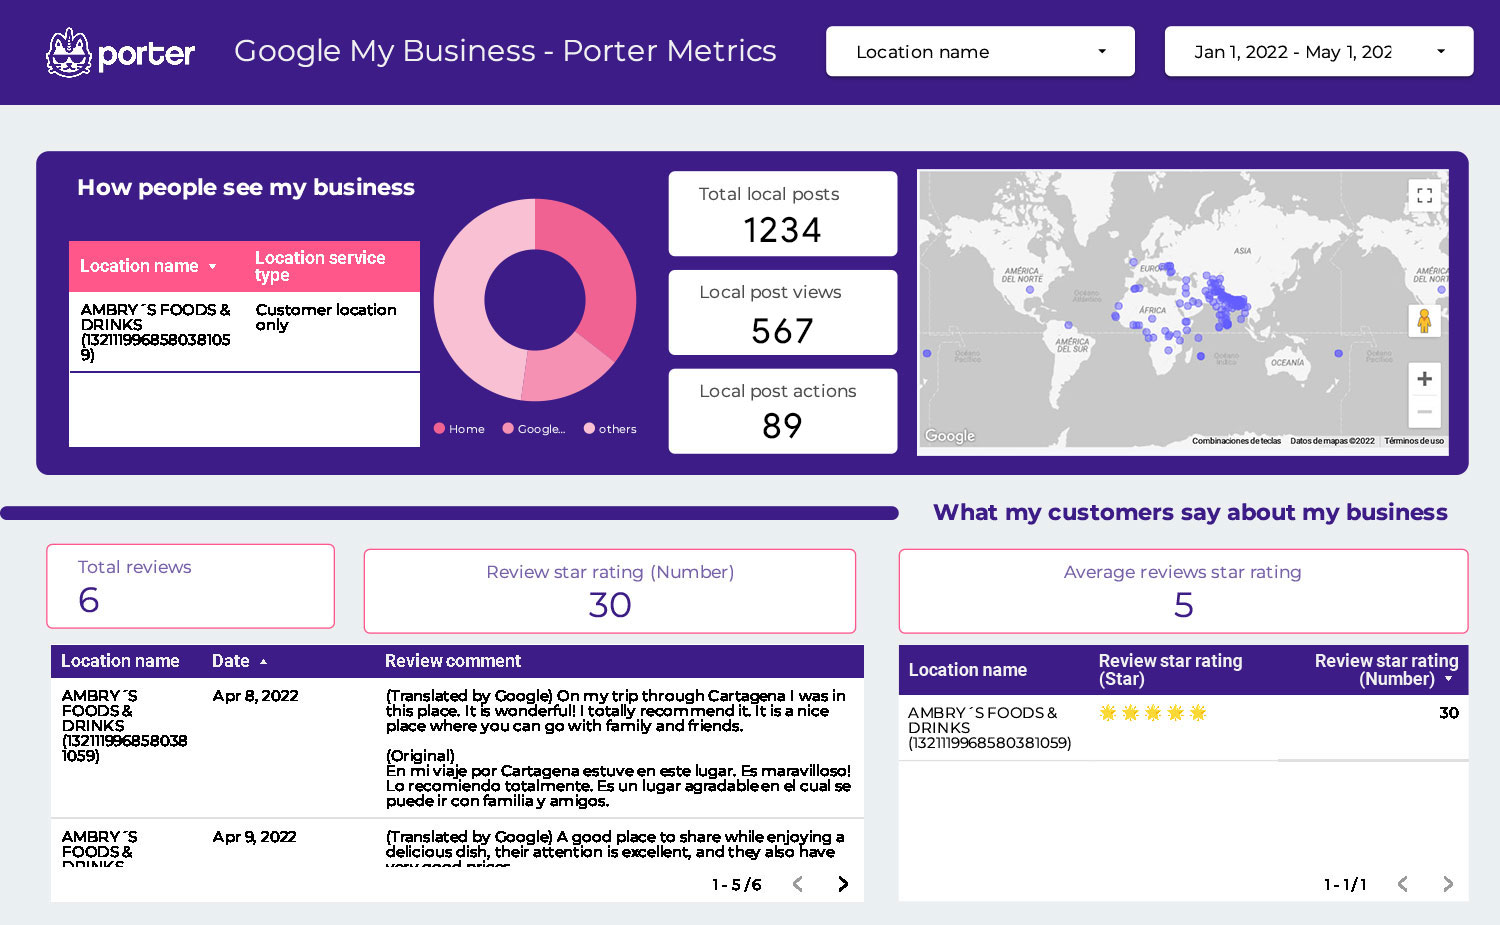
Google Business Profile report template
Use this free Facebook Insights report template to track yout efforts and visualize them in an interactive dashboard
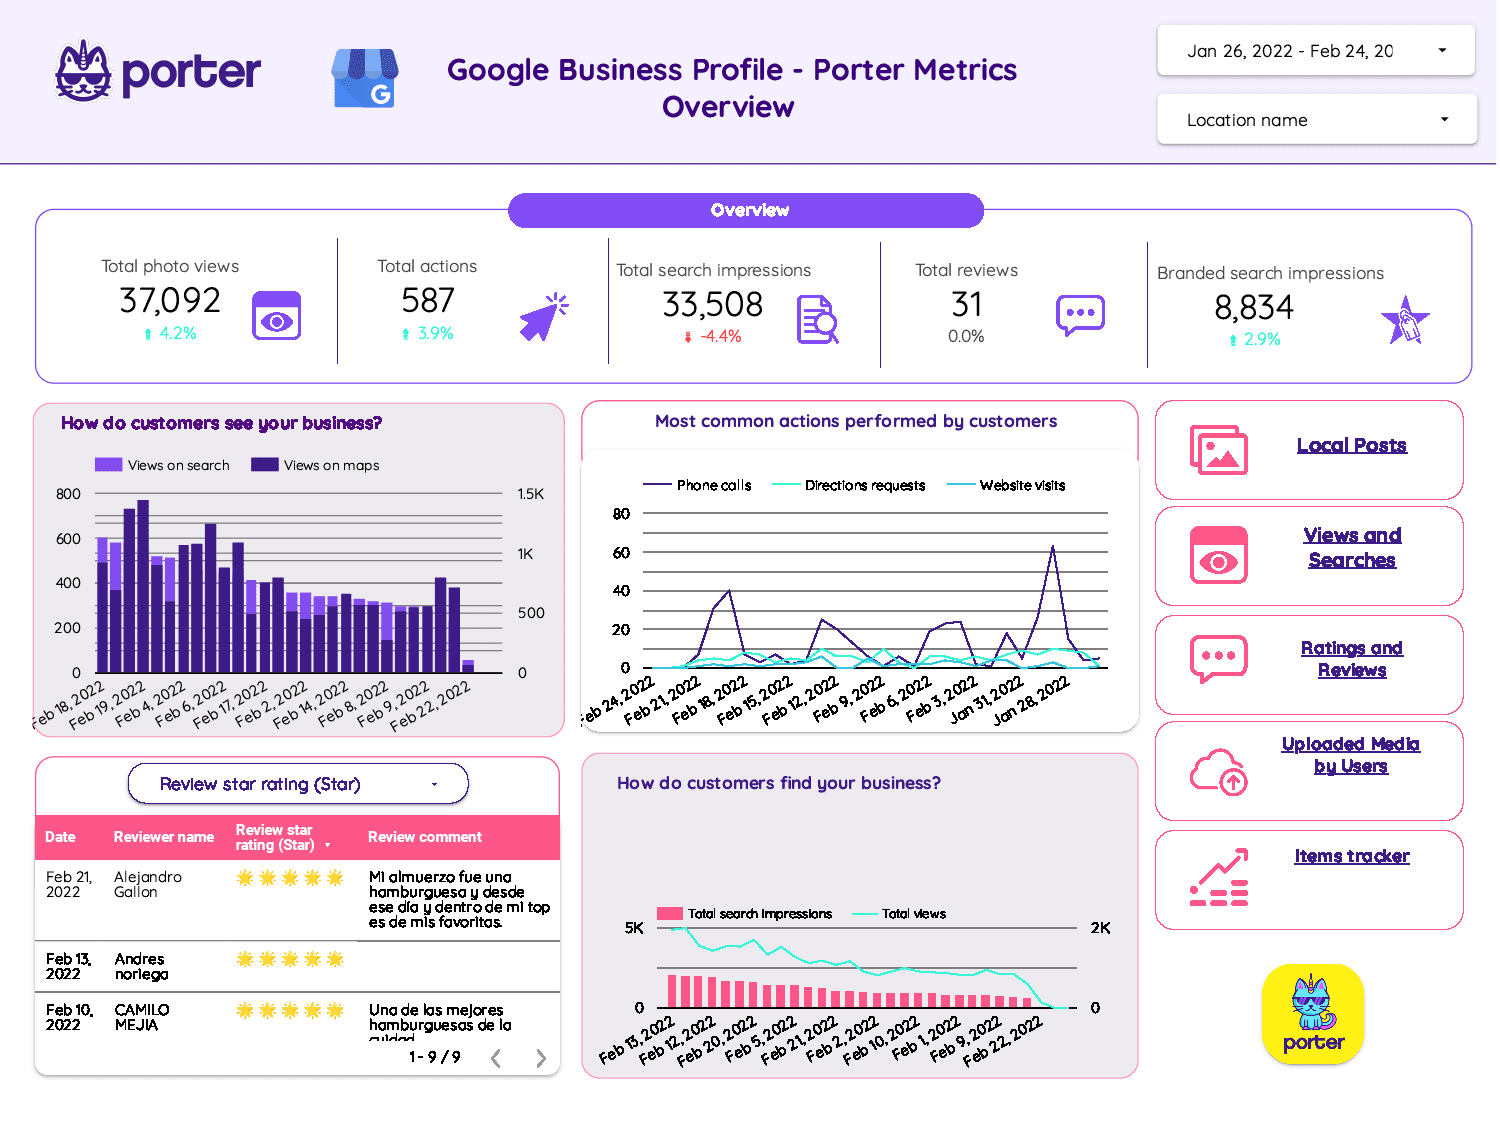
Free Google My Business report template for Looker Studio
Looking for a Free Google Business Profile (Google My Business) report template for Looker Studio? Check out our free report templates.
Other reports
Hubspot CRM Contacts Report Template
Download this CRM contacts report template for Google Looker Studio to display your key metrics and start tracking your Hubspot account.
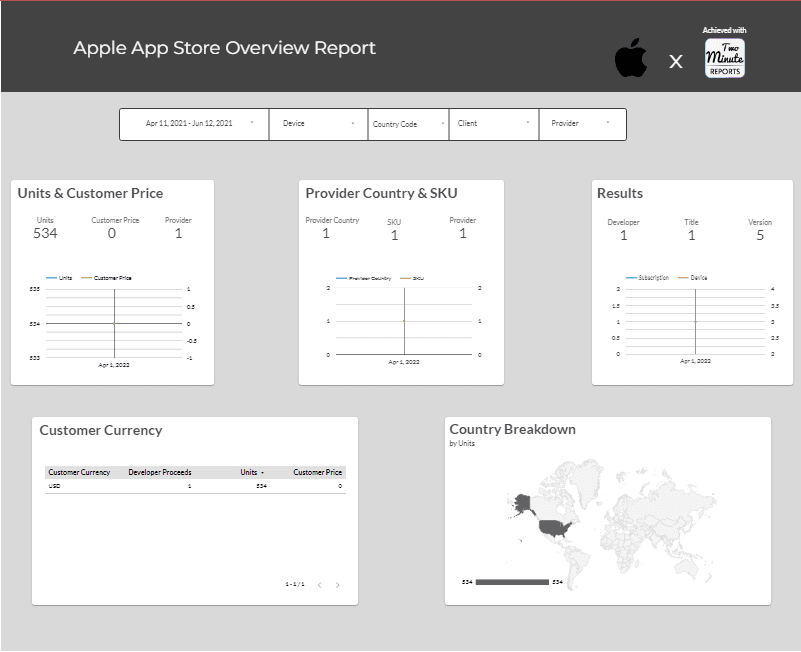
Apple App Store Overview Report
This is a unique and interactive template for the Apple App Store. It provides descriptive line charts for units and customer price, provider country and SKU, and results. Additionally, various charts are available for customer currency, country breakdown, device breakdown, product type identifier, developer proceeds, and country of proceeds.
All of these metrics can be controlled using the two control bars located at the top of the template, which can change different metrics.
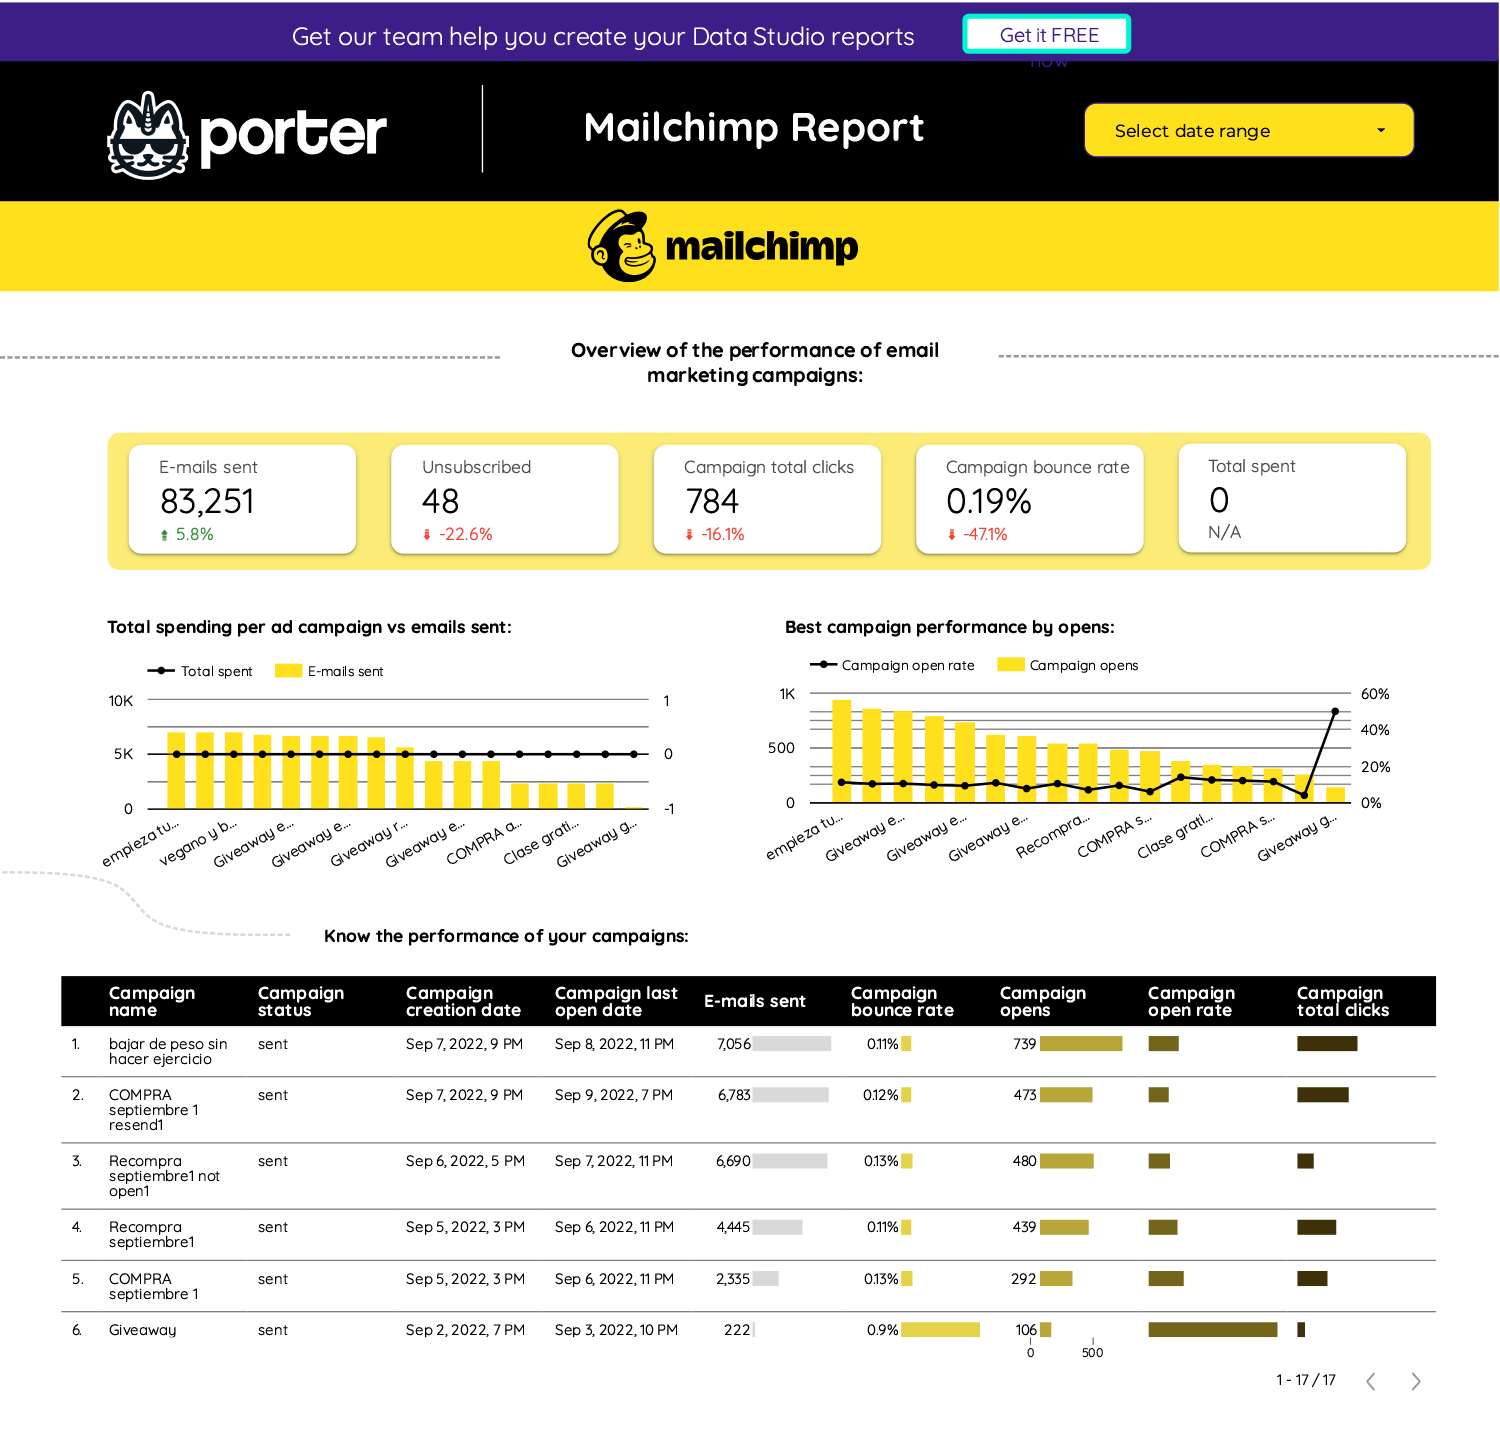
Free Mailchimp Report template on Looker Studio
Main metrics: E-mails sent, unsubscribed, campaign total clicks, bounce rate, totally spent, campaign open rate, campaign opens, and more
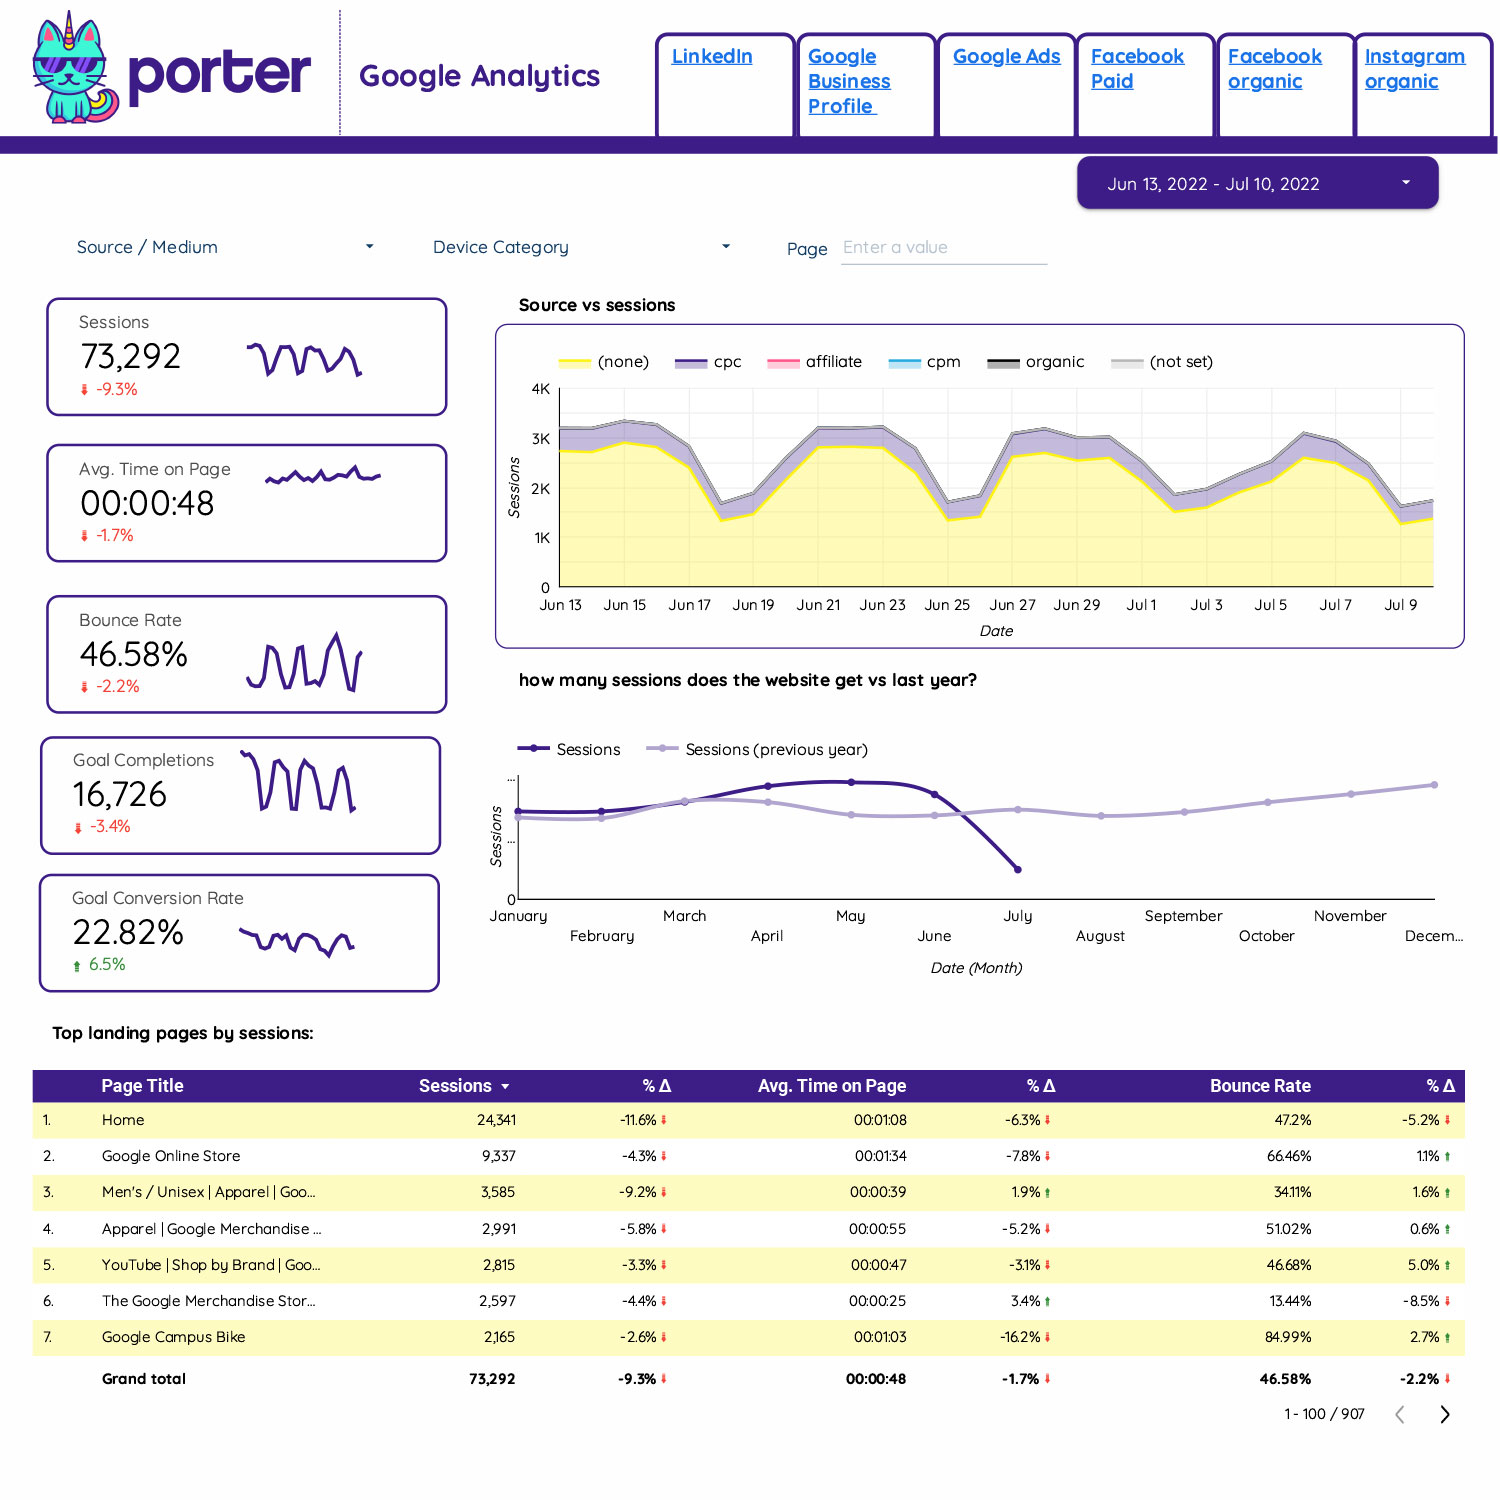
What about Google Analytics Looker Studio reports?
Both PorterMetrics and Two Minute Reports have free templates for Google Analytics too.
But, to be honest, in the long term, it is cheaper to use official Google Analytics connectors and rather pay a one-time fee for high-quality Looker Studio Templates for Google Analytics 4.